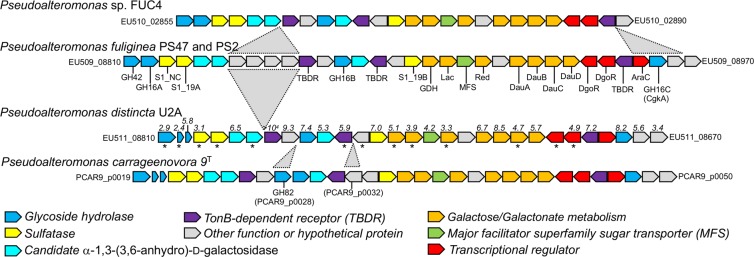
Fig. 1. Schematic of the carrageenan PULs in newly isolated Pseudoalteromonas sp. compared with Pseudoalteromonas carrageenovora 9T.
Each gene is represented by an arrow, which are color coded according to putative function. Gray triangles indicate inserted regions. All other genes are otherwise orthologous. Numbers above the genes in the Pseudoalteromonas distincta U2A CarPUL indicate the Differential Expression Log2 Ratio of transcript levels detected when grown on ι-carrageenan vs. galactose as determined by RNA sequencing experiments (values are only shown for genes with |Log2 Ratios| > 1.5 and p-values < 0.05). Asterisks (*) below the genes indicate those with significant transcripts (>10 transcripts per kilobase million) when grown on galactose. Locus tags for the first and last genes are provided. See also Supplementary Table 2 for more details of the gene annotations.

