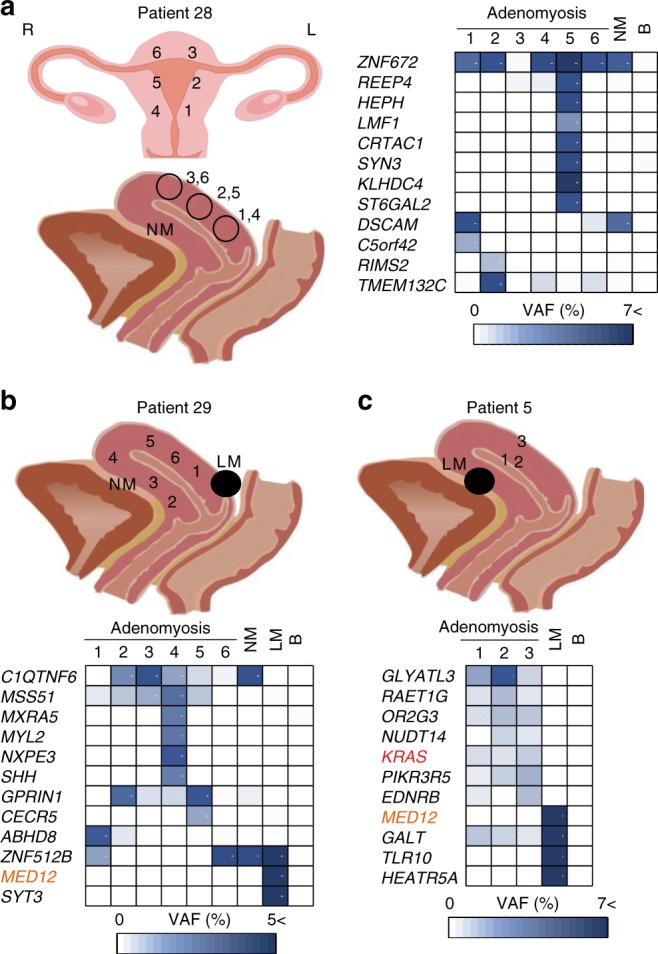
Fig. 3. Oligoclonality in adenomyosis tissues as revealed by multi-regional sampling.

a Left panel: coronal plane (top) and sagittal plane (bottom) schemes indicating the sites of multi-regional adenomyosis samples (1–6) and adjacent histologically normal myometrium (NM) that were acquired from Patient #28 and subjected to mutational profiling. R, right; L, left. Right panel: VAFs of mutations in the indicated genes in the indicated multi-regional samples profiled for each individual adenomyosis lesion, NM, or peripheral blood (B) sample from Patient #28. VAF values are shown using a color scale. b, c Top panels: sagittal plane schemes indicating the sites of multi-regional adenomyosis samples plus NM and leiomyoma (LM) samples that were acquired from Patient #29 (b) or Patient #5 (c) and subjected to mutational profiling. Bottom panels: analysis of VAFs for the samples in the top panels as for a. For a–c, raw VAF values (%) for each sample are shown in Supplementary Data 14–16.
