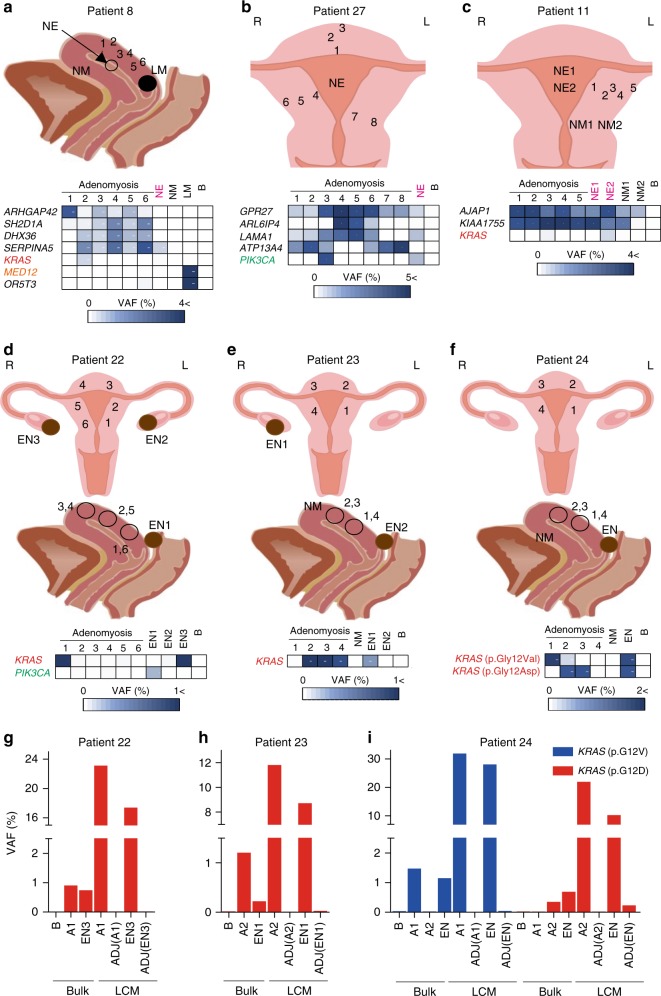
Fig. 4. Multi-regional sampling reveals shared mutations in adenomyosis, endometriosis, and adjacent normal endometrium.
Sagittal plane scheme (top) and VAF analysis (bottom) of sites of multi-regional adenomyosis (1–6) plus normal endometrium (NE), normal myometrium (NM), leiomyoma (LM), and blood (B) samples from Patient #8. VAF values are depicted as in Fig. 3. b, c Coronal plane scheme (top) and VAF analyses (bottom) of multi-regional adenomyosis plus NE and/or NM samples from the indicated patients. d–f Coronal plane scheme (top), sagittal plane scheme (middle), and VAF analyses of multi-regional adenomyosis samples plus endometriosis samples (EN) and/or NM samples from the indicated patients. For a–f, raw VAF values (%) for each sample are shown in Supplementary Data 17–19. g–i Quantification of VAF values as determined by TDS of the indicated genes in frozen (Bulk) and LCM tissues from the indicated patients. Bulk tissues included peripheral blood (B), adenomyotic lesions (A), and endometriotic lesions (EN). LCM tissues included epithelial component of adenomyosis (A), endometriosis (EN), and normal adjacent tissues (ADJ). For g–i, raw VAF values (%) for each sample are shown in Supplementary Data 21.

