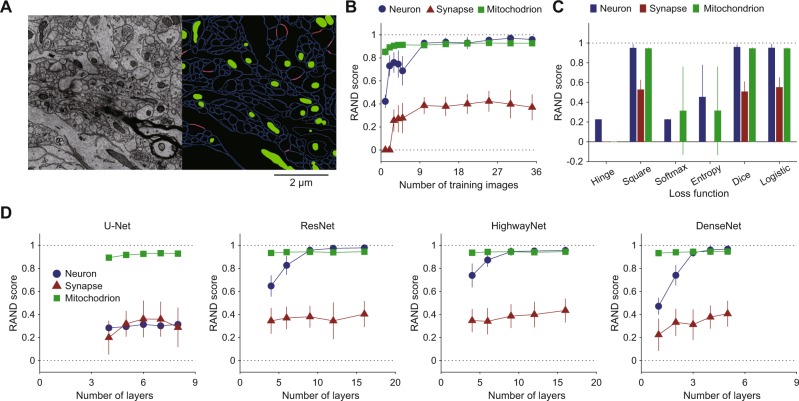
Figure 3.
Performance survey in 2D CNN-based segmentation of neurons, synapses, and mitochondria. (A) One of target EM images (left, SNEMI3D) and ground truth segmentation (right). Each image panel has 1024 × 1024 voxels (3 nm/voxel in x-y plane), and 100 z-slices (3 nm/voxel in z slice). In the right panel, blue and red lines indicate cellular membranes and synapses, respectively, and green areas indicate mitochondria. (B) Training image number dependence of segmentation accuracy (n = 15, mean ± SD; RAND score, see Methods). The RAND score approaches 1 if the inferred segmentation is similar to the ground truth. (C) Loss function dependence of segmentation accuracy (n = 60, mean ± SD). Here, “Square” denotes least square, “Softmax” denotes SoftMax cross-entropy, and “Entropy” denotes multi-class and multi-label cross-entropy. (D) Network topology dependence of segmentation accuracy (n = 15, mean ± SD). In B-D, all of the parameters except the target parameters were set as follows: the number of training images: 1; loss function: least square; network topology: ResNet; number of layers: 9; number of training epochs: 2000; number of training images: 5 (standard CNN). The 2000 training epochs gave steady states of their losses.

