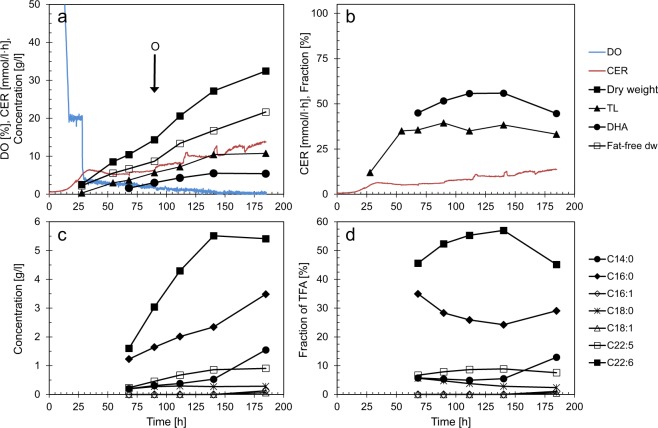
Figure 2.
Cell growth and lipid production in fermentations with O2-limitation. Data for one of four replicate fermentations are shown. Concentrations are corrected for dilution due to addition of glycerol and acid/base. O: Sampling point for transcriptome analysis. (a,c) Concentrations, dissolved oxygen (DO) and CO2 emission rate (CER). (b,d) Fractions (%): Total lipid (TL) of dry weight (dw); FA (fatty acids) of TFA (total fatty acids)

