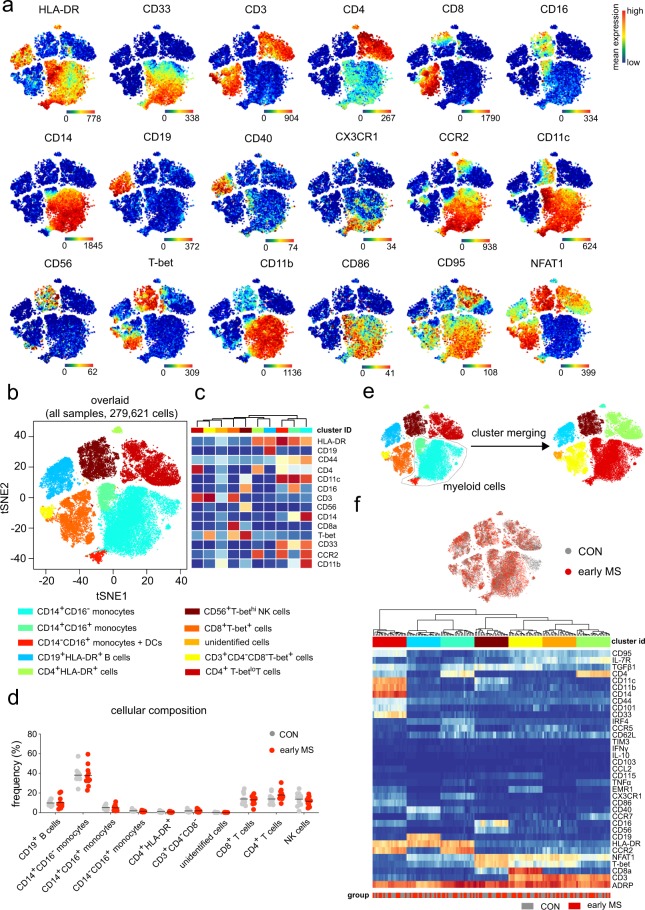
Figure 2.
Immune phenotyping of peripheral blood mononuclear cells (PBMCs) – Panel A. (a) Representative reduced-dimensional single-cell t-SNE maps (of a healthy control) from biologically independent samples of patients with early MS (n = 11) and healthy controls (n = 11). Each dot represents one cell. The 2D t-SNE maps were generated based on expression levels of all markers of Panel A (Supplementary Table 2). The colour spectrum represents individual marker-expression levels (red, high expression; dark blue, no expression). (b) The t-SNE plot of concatenated FCS files from all 22 samples. The colouring indicates ten defined clusters representing major PBMC-lineages. (c) Heat map cluster demonstrates the expression levels of 14 markers used for the cluster analysis. (d) Quantified frequencies (%) of each defined cell subset showing comparable cellular composition in PBMCs from the two studied groups (black lines show mean values of the datasets). (e) Myeloid clusters including CD14+CD16−, CD14+CD16+, CD14−CD16+ monocytes and dendritic cells were manually merged prior to further data analysis. (f) Overlaid t-SNE plot shows cellular distribution of control (grey dots) and early MS (red dots) samples (top image). Heat map and cluster analysis of all samples on the basis of the mean expression of 36 markers. Samples are indicated by dendrograms. Heat colours show overall expression levels (red, high expression; dark blue, no expression).

