Figure 7.
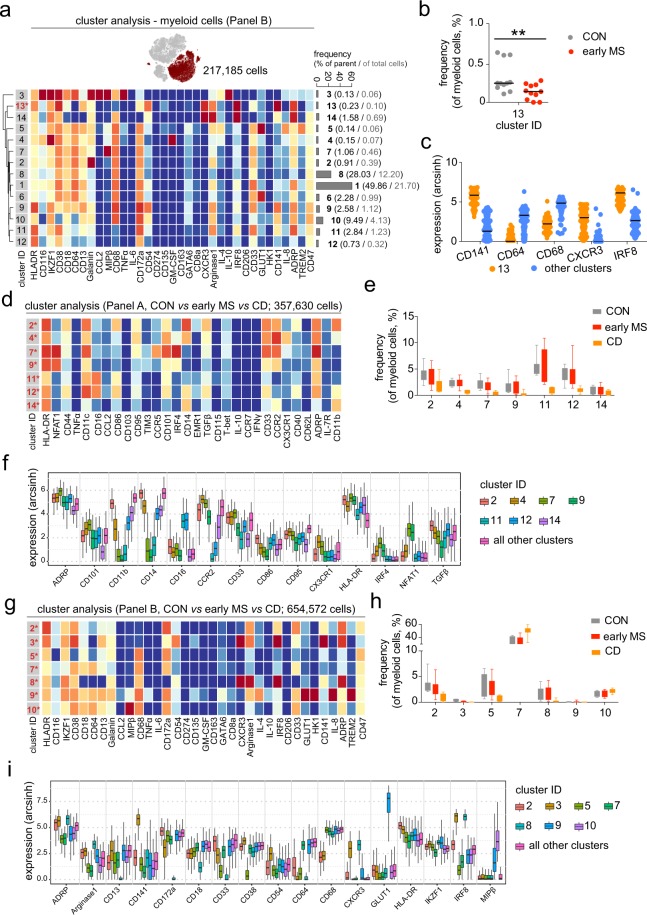
Phenotypic changes in myeloid cell populations from patients with early MS. (a) t-SNE map highlights myeloid population (merlot dots). Heat map and cluster analysis of myeloid cells from all samples on the basis of the mean marker expressions (Panel B). The bar graph shows mean cluster frequencies as % of parent (black number) and % of total cells (grey number). Cluster 13 (* in red) shows differential abundances between the controls (CON) and patients (early MS). (b) The graph shows differences in frequency (%) of cluster 13 between the two studied groups. (c) Median expression levels as shown in the dot plot representation for randomly selected cells (n = 256/cluster) in the cluster 13 (orange) and all other clusters (blue). (d) Heat map and cluster analysis of differentially abundant subsets of myeloid cells between healthy controls (CON, n = 11), patients with early MS (early MS, n = 11) and Crohn’s disease (CD, n = 8) on the basis of the mean expression of analysed markers using the antibody Panel A. (e) The graph shows differences in the frequency (%) of all seven differential clusters compared between the three studied groups. (f) The Boxplot shows median expression levels of the discriminating markers defining the differentially abundant subsets. The plot was a representation for randomly selected cells (256 cells per cluster) in the seven differential clusters. (g) Heat map and cluster analysis of differentially abundant subsets of myeloid cells between the three studied groups on the basis of the mean expression of analysed markers using the antibody Panel B. (h) The graph shows differences in frequency (%) of all seven differential clusters compared between the three studied groups (CON = grey; early MS = red; CD = orange). (i) The Box plot shows median expression levels of the discriminating markers defining the differentially abundant subsets. The plot was a representation for randomly selected cells (256 cells per cluster) in the seven differential clusters. A P value < 0.05 was considered statistically significant at 10% FDR, determined using GLMM (**P < 0.01, unadjusted).

