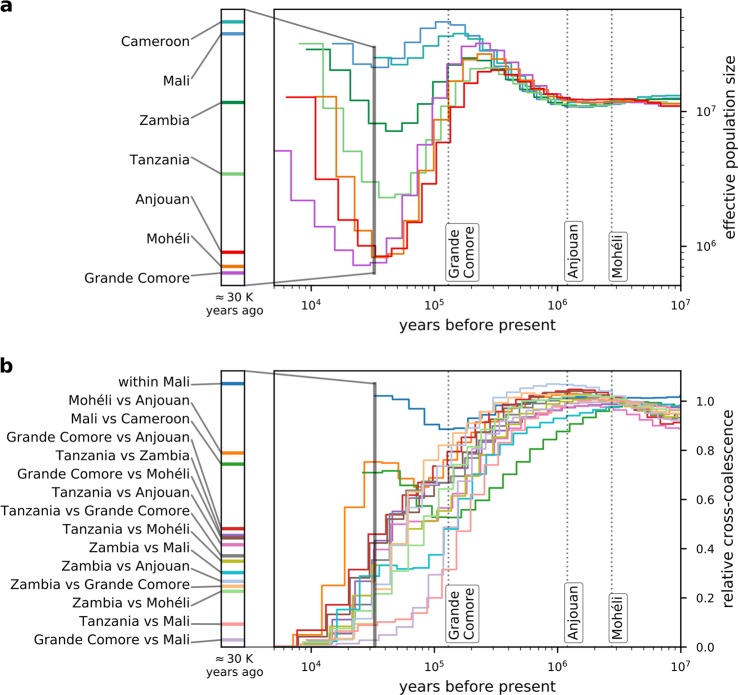
Fig. 6. Historical effective population sizes and coalescence estimates.
a Historical effective population sizes. b Relative cross-coalescence (RCC) between populations. The dotted lines depict the geological appearance of the three Comoro islands55. The vertical bar marks the time point most closely to present where estimates for all populations are available and is shown enlarged at the left. Legend entries are given in the same order as they appear in the bar. Note the reading direction “deep to recent past” from right to left and the logarithmic scales in plots (all but y axis in b).

