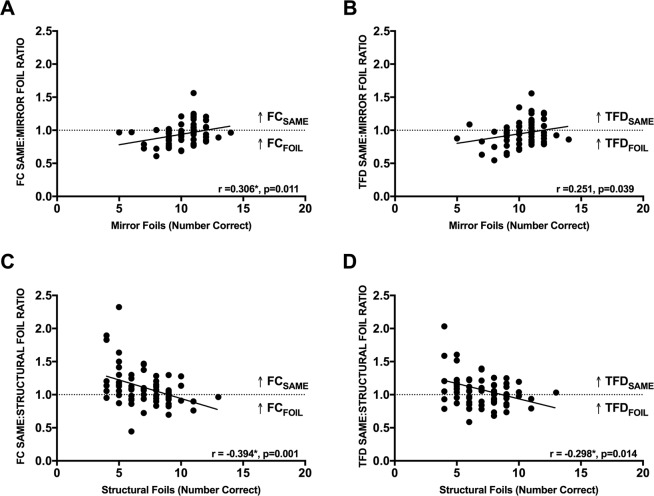
Figure 4.
(A,B) Scatter plots between the number of correct responses on mirror foil trials and the ratio of fixation count (FC) and total fixation duration (TFD) between same and mirror foil images. (C,D) Scatter plots between the number of correct responses on structural foil trials and the ratio of fixation count (FC) and total fixation duration (TFD) between same and structural foil images. The dotted line represents the threshold between having a higher fixation count or longer total fixation duration on same or foil images. *Represents significant correlations (r) at a Sidak adjusted p < 0.025.

