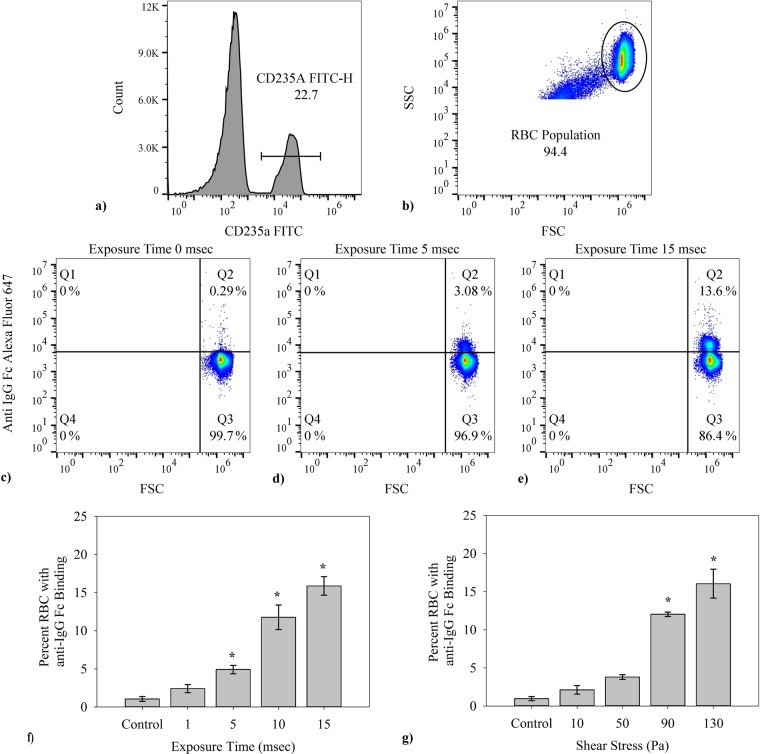
Figure 2.
The general flow cytometry methods used in determining percent of cells which fluoresced are shown. Flow cytometry results were collected via the BD Accuri C6 flow cytometer then further analyzed using FlowJo software. (a) In every case the events were first gated for presence of CD235a (FITC conjugated), (b) then additionally gated according to FSC-SSC to exclude any cellular debris or microparticles. (c–e) Representative output from the BD Accuri C6 Flow Cytometer for RBCs in a control, 5 msec and 15 msec high shear exposure time samples, respectively from left to right. Each y-axis corresponds to fluorescence intensity from the FL4-anti-IgG Alexa Fluor 647 conjugate and the x-axis shows FSC, relating to event size. Each individual test was run for 75,000 total RBCs. (f) The percent of CD235a + RBCs with IgG attached grew with duration of shear after a single exposure in a microfluidics channel at 100,000 s−1 (n = 5, p < 0.001). (g) The fraction of CD235a + RBCs binding IgG increased with the magnitude of the stress in the viscometer for 2 min. (n = 5, p < 0.001) Data presented in (f,g) is the average ± standard error, with * representing significance according to post hoc Tukey HSD. Additional tests for Alexa Fluor 647 Mouse IgG2a, k Isotype Ctrl Antibody to account for the possibility of non-specific binding was omitted in (f,g), having on average 0 ± 0.1% average binding across all tests.

