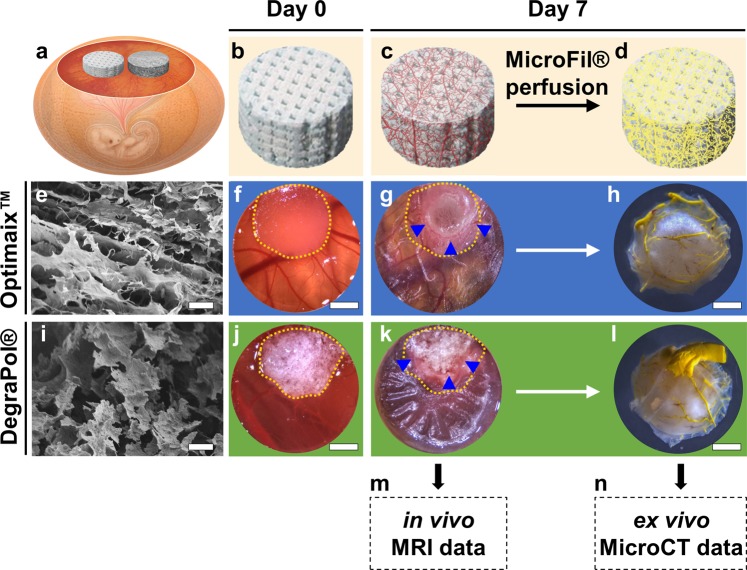
Figure 4.
Experimental setup. (a) Chorioallantoic membrane (CAM) assay with two different biomaterials that are investigated in the same organism. (b) Empty scaffold on day 0. (c) Vascularized scaffold on day 7 as used for (m) magnetic resonance imaging (MRI). (d) Scaffold after perfusion with yellow MicroFil as used for (n) microcomputed tomography (MicroCT). (e) Scanning electron microscopy (SEM) image showing the lamellar structure of the Optimaix scaffold at 100x magnification. Scale bar = 100 μm. (f) Optimaix scaffold right after placement on the CAM and (g) after 7 days of incubation on the CAM. (h) Bottom view of the same sample after perfusion with MicroFil. (i) SEM of the DegraPol scaffold at 100x magnification shows a highly porous foam structure. Scale bar = 100 μm. (j) DegraPol scaffold right after placement on the CAM and (k) after 7 days of incubation on the CAM. (l) Bottom view of the same sample after perfusion with MicroFil. The yellow dotted lines in (f,g,j,k) indicate the outline of the scaffolds on day 0. Blue arrowheads point at capillaries at the edge between CAM and scaffold. Scale bars in (f–h,j–l) = 200 μm.

