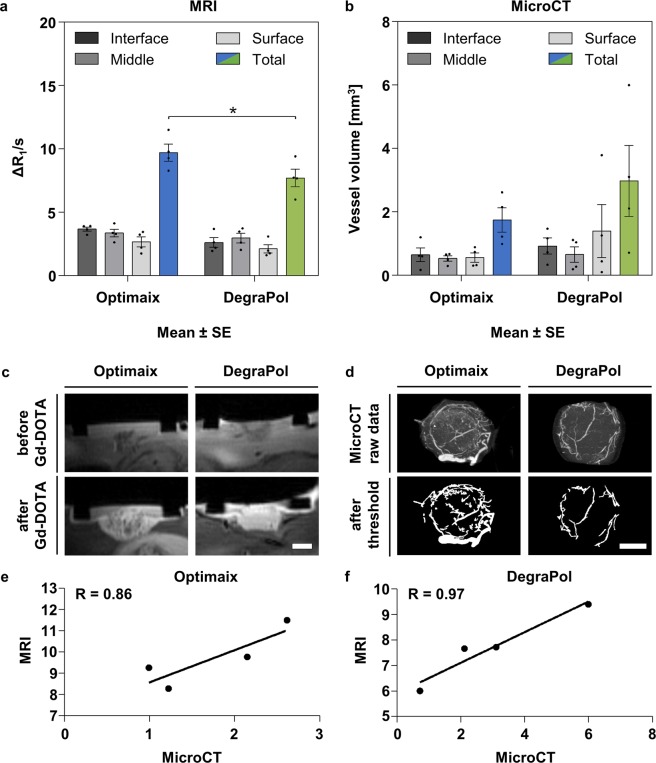
Figure 5.
Imaging and analysis of the vasculature within Optimaix and DegraPol scaffolds. (a) Functional assessment of blood perfusion capacity by MRI. Mean ± SE, n = 4, *p < 0.05. (b) Vessel volume determined by MicroCT after MicroFil perfusion of the vasculature. Mean ± SE, n = 4. (c) Representative magnetic resonance image of Optimaix and DegraPol scaffolds on the CAM before and after injecting paramagnetic Gadolinium-DOTA contrast agent. (d) Representative maximum intensity projections of MicroCT scans and of binarized images for both Optimaix and DegraPol scaffolds. (e) Correlation of total blood perfusion capacity (MRI) and total vessel volume (MicroCT) for Optimaix scaffolds. (f) Correlation of total blood perfusion capacity (MRI) and total vessel volume (MicroCT) for DegraPol scaffolds. Scale bars = 250 μm.

