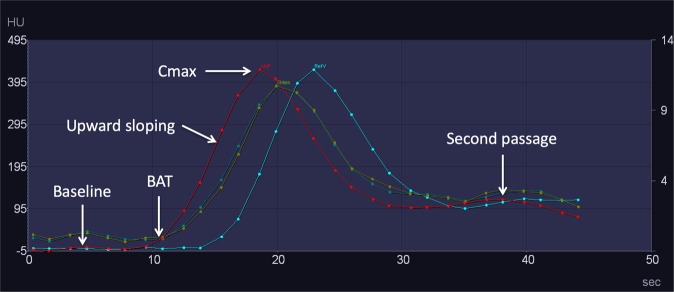
Figure 3.
Tissue attenuation curves obtained from a CTP study processed with iMAR from a 58-year-old female after coiling of a ruptured left posterior communicating artery aneurysm. The arterial input function is represented by the red curve, the venous reference by the blue curve, and the tissue curves (left and right hemispheres), by the green curves. While comparing the curves from the corrected and uncorrected datasets, special attention was paid to the marked points (baseline, bolus arrival time (BAT), upward sloping, contrast maximum (Cmax), and second passage peak).

