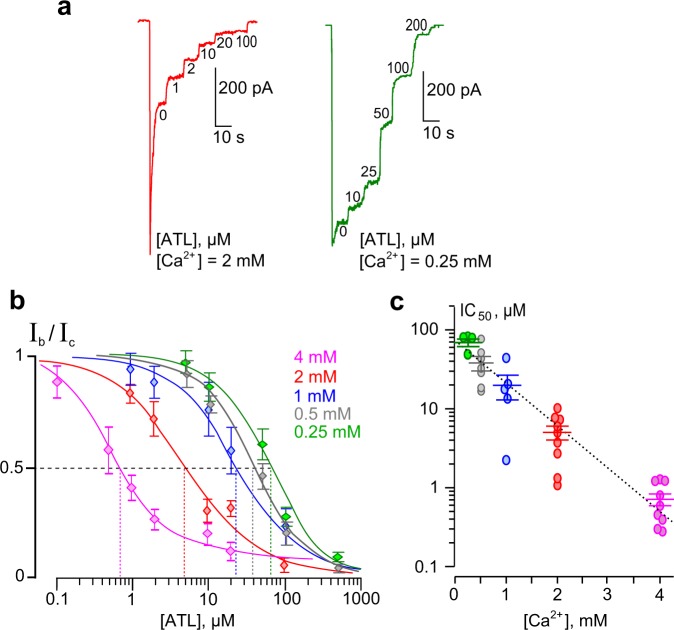
Figure 2.
Ca2+-dependent inhibition of NMDAR currents by amitriptyline (ATL). (a) Currents activated by 100 μM NMDA + 30 μM Gly recorded at −70 mV in the presence of 0.25 mM and 2 mM Ca2+ in the bathing solution in the absence of ATL (0) and in the presence of rising ATL concentrations ([ATL]) indicated by numbers at corresponding level of currents (in μM). (b) Concentration-inhibition curves for ATL for currents activated by 100 μM NMDA + 30 μM Gly recorded at −70 mV in the presence of different [Ca2+]s in the bathing solution. Symbols show mean values ± S.E.M of the relative amplitudes of currents (Ib/Ic) in the presence (Ib) and absence (Ic) of different ATL concentrations ([ATL]) from 5–9 measurements. Solid lines are fits to the data with the Hill equation (Eq. 1). (c) Dependence of IC50 (a concentration that causes a half-maximal inhibition) for ATL inhibition of NMDAR currents on external [Ca2+] obtained from experiments illustrated in panels a and b. Data from each experiment (symbols) and mean values ± S.E.M. are shown. The IC50 values are 63.0 ± 9.3 μM, h = 1.4 ± 0.1 (n = 8); 37.6 ± 7.7, h = 1.5 ± 0.1 (n = 7); 21.6 ± 8.7 μM, h = 1.6 ± 0.5 (n = 5); 4.9 ± 1.0 μM, h = 1.2 ± 0.1 (n = 9); and 0.72 ± 0.12 μM, h = 1.5 ± 0.2 (n = 10) in the presence of 0.25 mM, 0.5 mM, 1 mM, 2 mM and 4 mM Ca2+ in the bathing solution, respectively. The dotted line is an approximation of the data by a single exponential function. An e-fold change in IC50 is achieved by a shift of [Ca2+] of 0.63 mM.

