Figure 3.
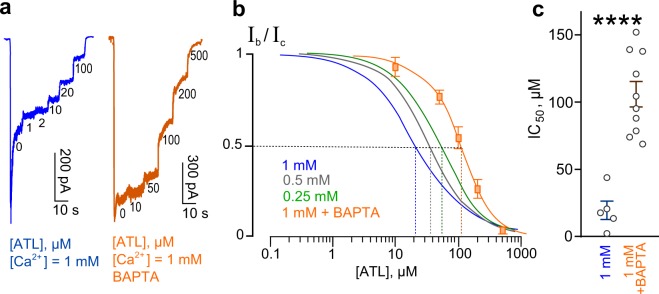
Loading neurons with BAPTA to chelate intracellular Ca2+ reduces ATL inhibition of NMDAR currents. (a) Currents activated by 100 μM NMDA + 30 μM Gly recorded at −70 mV in the presence of 1 mM Ca2+ in the bathing solution in the absence of ATL (0) and in the presence of rising ATL concentrations ([ATL]) indicated by numbers at corresponding level of currents (in μM). The blue trace shown was recorded from intact neuron and the orange trace - from BAPTA-loaded neuron. (b) Concentration-inhibition curve for ATL obtained from currents activated by 100 μM NMDA + 30 μM Gly recorded at −70 mV in the presence of 1 mM [Ca2+] in the bathing solution. Orange symbols represent mean values ± S.E.M of the relative amplitudes of currents (Ib/Ic) in the presence (Ib) and absence (Ic) of different ATL concentrations ([ATL]) measured from neurons loaded with BAPTA (n = 10). Solid orange line fits the data with the Hill equation (Eq. 1). The blue, gray and green curves are replotted from Fig. 2b to display the difference of results between control and BAPTA-loaded neurons. (c) Comparison of ATL IC50 values obtained in 1 mM [Ca2+] for control (21.6 ± 8.7 μM, n = 5) and BAPTA-loaded (105.8 ± 9.5 µM, n = 10) neurons. Data from each experiment (symbols) and mean values ± S.E.M. are shown. ****Data are significantly different (p = 0.0001, Student’s two-tailed t-tests).

