Figure 3.
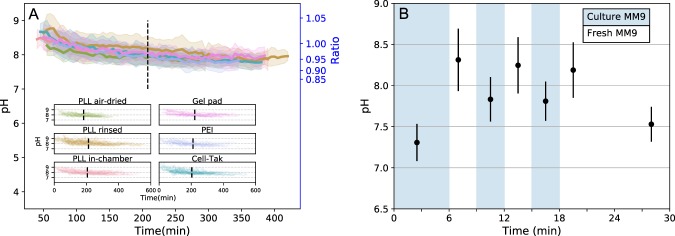
Intracellular pH dynamics of bacterial cells immobilised on a given surface. (A) Single cell intracellular pH is measured with cytoplasmic pHluorin during cell growth on different surfaces. Solid line and shaded area show the mean and standard deviation. Dashed line separates the mean first and second generations of bacteria. All tested immobilisation methods exhibit similar tendencies: pH values start from pH and decrease to about pH within ~7 h of observation. The inset shows all single-cell traces plotted for each condition. (B) Cells in a flow chamber are sequentially treated with the medium taken from a growing culture (blue regions) and fresh medium (white regions). Media exchange occurs in a short pulse manner at the beginning of each period, while no flow is applied during imaging. Data points show the mean of N > 500 measured bacteria with standard deviation as error bar.

