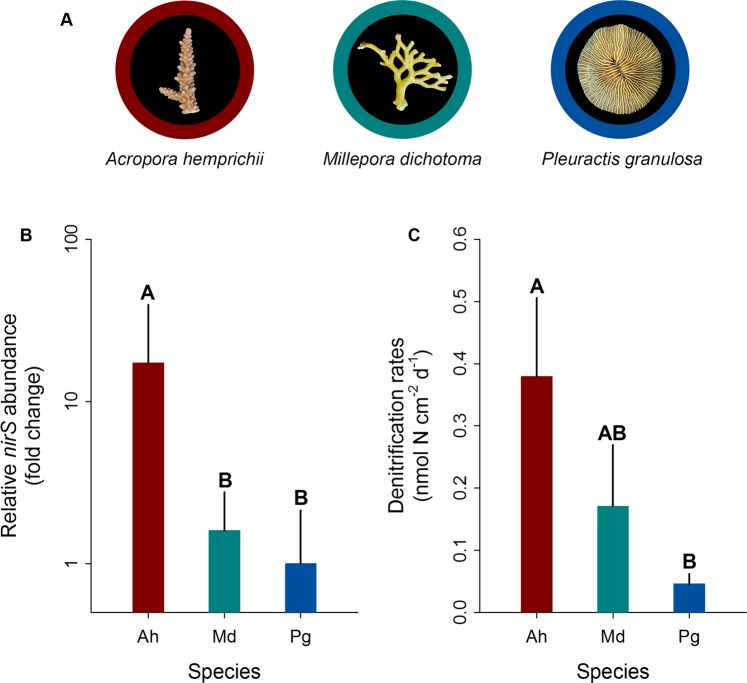
Figure 2.
Relative nirS gene copy numbers and rates of denitrification associated with three Red Sea coral species. (A) Representative photographs of investigated species, (B) fold changes in relative nirS gene copy numbers normalized to ITS2 copy numbers as measured by quantitative PCR, and (C) denitrification rates measured indirectly via the combined blockage/reduction acetylene assay (COBRA-assay). Ah = A. hemprichii, Md = M. dichotoma, and Pg = P. granulosa. Fold changes were calculated in relation to P. granulosa; bars indicate the mean; error bars indicate upper confidence intervals (+ 1 SE); n = 4 per species, except Ah and Pg in (B) (n = 3). Different letters above error bars indicate statistically significant differences between groups within each figure (pair-wise PERMANOVAs, p < 0.05).

