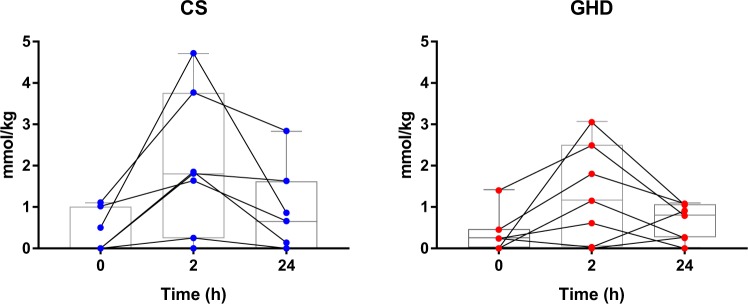
Figure 3.
Changes in intramyocellular acetylcarnitine (AcCtn) concentrations of seven patients with GHD (right) and seven CS (left). Intramyocellular AcCtn concentrations were measured by proton magnetic resonance spectroscopy (1H-MRS) at baseline (0 h), 2 hours after moderately intense exercise (2 h), and 24 hours post-exercise (24 h). Changes of AcCtn concentrations over time did not significantly differ between GHD patients and CS (ANOVA p for group = 0.45). Bars, boxes and whiskers represent median, IQR and range. GHD = growth hormone deficiency, CS = control subjects.

