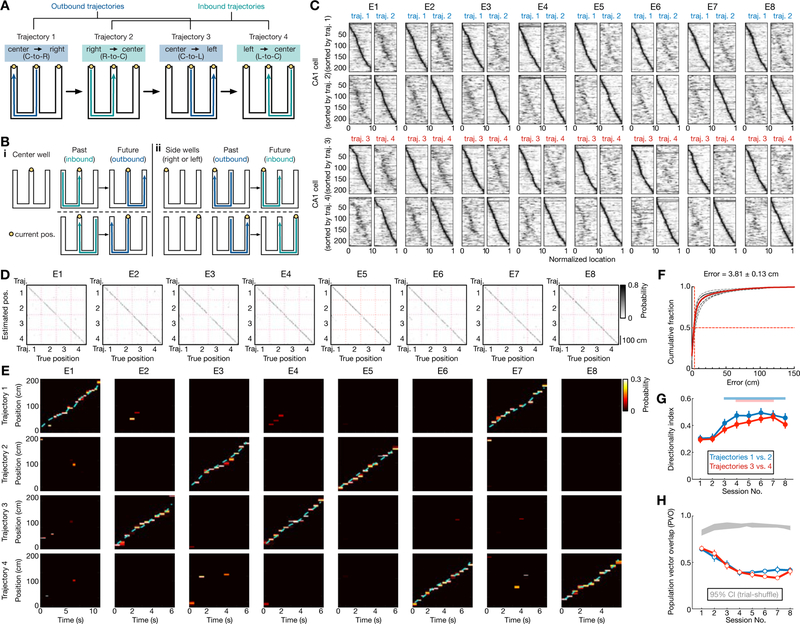
Figure 1. Hippocampal place-cell sequences distinctly represent different behavioral trajectories during learning of a W-maze spatial memory task.
(A) W-maze spatial alternation task design, depicting the correct behavioral sequence of outbound (blue) and inbound (teal) trajectories (labelled 1–4) for reward. Right-left indicated according to animal direction.
(B) Past and future trajectories during transitions at reward wells. (i) Two correct behavioral sequences at the center well. (ii) One correct behavioral sequence for each side well (left or right well).
(C) Place fields of all CA1 place cells (n = 216) recorded from 6 rats continuously across 8 learning sessions (or epochs; denoted as E1–8) in single-day learning. The fields for trajectories 1 and 2, sorted according to peak positions on trajectory 1 or 2, are shown on the top two rows. The bottom two rows are for trajectories 3 and 4. Horizontal axes denote normalized position along the start to end of the corresponding trajectory.
(D-F) Position reconstruction based on CA1 ensemble spiking during active running behavior on trajectories (> 5 cm/s). Decoding performance was estimated using a leave-one-out cross-validation. (D) Example confusion matrices depicting true and estimated positions during running on trajectories 1–4. (E) Illustrative estimated position probabilities using data from a single animal for individual sessions. Cyan line: actual animal trajectory. (F) Cumulative position decoding errors across all animals. Dashed lines: individual animals; Red line: all animals; Solid black line: the example animal shown in (D-E). Median error of all sessions (vertical red line) noted on top. Decoding error: 6.30 ± 0.47 cm for Session 1; 3.58 ± 0.35 cm for Session 8 (in median ± SEM).
(G and H) Directional selectivity of place cells. (G) Directionality index (DI) of place cells across learning sessions. Red and blue bars above indicate significant increases from the first session (p < 0.05, Friedman tests with Dunn’s post hoc). Error bars: SEM. (H) Similarity of the place-cell population in two running directions was computed using the population vector overlap (PVO). Grey shadings: 95% CIs of the shuffled distributions from each animal using trial-label shuffles. Blue and red lines with error bars: means with SEMs for right (i.e., trajectories 1 vs. 2) and left (i.e., trajectories 3 vs. 4) trajectories, respectively. Note that distinct templates for each direction are apparent in the first session (p’s < 0.0001 compared to the shuffled data for individual rats, permutation tests).

