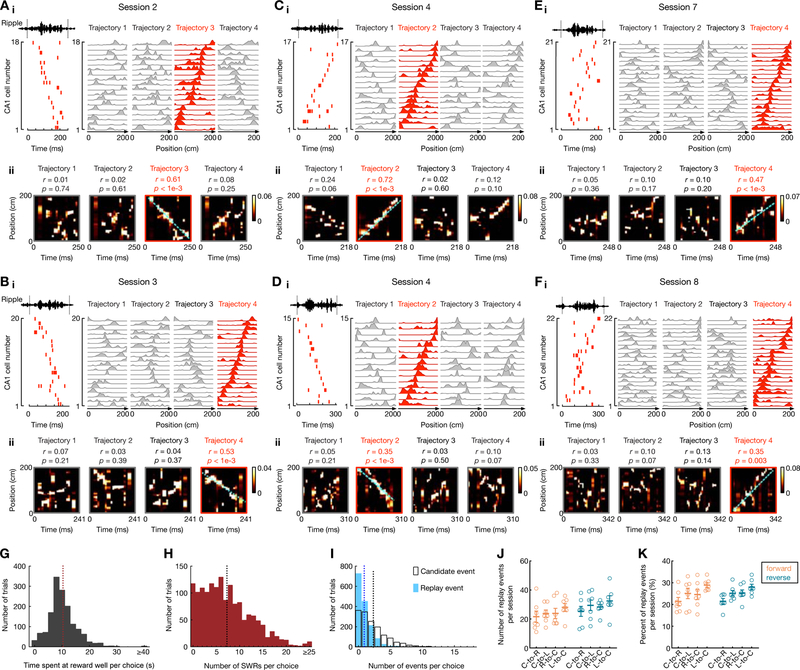
Figure 2. Continuous tracking of forward and reverse replay throughout learning.
(A-F) Six examples of forward and reverse replay of behavioral trajectories in different learning sessions using continuously tracked CA1 ensembles in one animal. (i) Left: Place-cell activity during a SWR, with ripple-filtered LFP (150–250 Hz) from one tetrode shown on top. Right: Corresponding linearized place fields on trajectories 1 to 4 sorted by their peak locations on the replayed trajectory (red). (ii) Bayesian reconstruction of the decoded behavioral trajectories with the replay quality (r) and p-value based on time-shuffled data denoted on top. Cyan lines: the linear fit maximizing the likelihood along the replayed trajectory. Color bars: posterior probability. See also Figure S2 for additional replay examples.
(G-I) Distributions of (G) animals’ immobility times at reward wells, (H) the number of SWRs, and (I) candidate events (open bars) and replay events (solid bars) detected in immobility periods per choice (i.e., per transition). Only correct trials are shown. Vertical dashed lines on the histograms represent the mean values (Immobility time: 10.3 ± 5.7 sec; SWRs: 7.3 ± 5.5 events; Candidate events: 2.3 ± 2.4 events; replay events: 0.9 ± 1.2 events; data are presented in mean ± SD).
(J and K) (J) Number and (K) percentage of forward and reverse replay events of different trajectory types (i.e., center-to-right, C-to-R; center-to-left, C-to-L; right-to-center, R-to-C; left-to-center, L-to-C). Each dot represents a session, summing over all 6 animals (sessions 1 and 2 were combined). Error bars: mean ± SEM. Note that the number of replay events of different trajectories was similar (F(7, 42) = 3.062 and p = 0.053 for J, F(7, 42) = 2.227 and p = 0.12 for K; repeated measures ANOVA).

