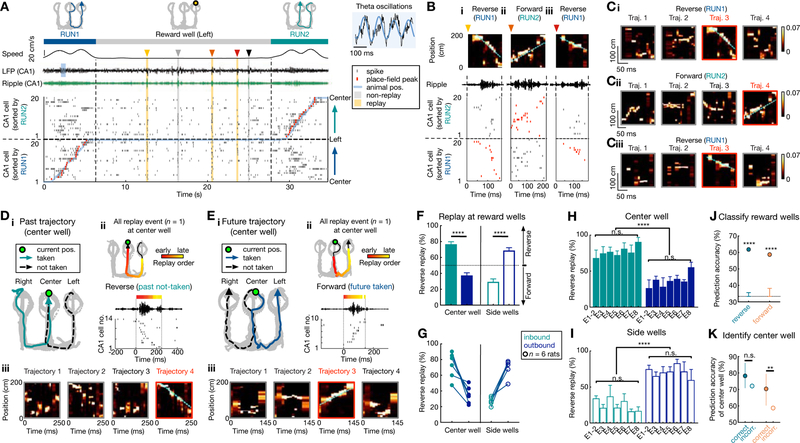
Figure 3. Reverse replay of possible past paths, forward replay of possible future paths.
(A-E) Illustration of past and future trajectories replayed by reverse and forward place-cell sequences at reward wells.
(A-C) Example of side reward well transition. (A) CA1 neural activity during an outbound-inbound sequence (RUN1 to RUN2), with replay events at the left side well. From top to bottom, the behavioral sequence, animal speed, broadband and ripple-filtered LFPs from one CA1 tetrode, raster plot of 20 place cells ordered by the positions of their place-field peaks (red ticks; linearized animal position in overlaid blue line). CA1 exhibits theta oscillations (8–10 Hz; blue LFP shading) during running, and SWRs during immobility, coincident with synchronous activity of place cells (indicated by arrowheads and shadings). Five synchronous candidate events were seen, with 3 events detected as significant replay sequences (yellow shadings). (B) Expanded view of the 3 replay events from (A), identified as reverse replay of RUN1 (past) and forward replay of RUN2 (future). (Bi-Biii) Each column shows the Bayesian reconstruction of the animal’s trajectory during replay (top), ripple-filtered LFP (middle), and spike raster of place cells (bottom) sorted as in (A) (raster corresponding to replayed trajectory, red). (Ci-Ciii) Bayesian reconstructions of the decoded behavioral trajectories 1–4 for replay events in Bi-Biii, (replayed trajectory bordered as red). Color bars: posterior probability. See also Figure S3 for similar center reward well example.
(D and E) Replay events during two example transitions at the center well. (i) Behavioral sequences for the center-well transition. (ii) A single replay event at the center well. Top: Bayesian reconstruction of the replayed trajectory. Colored points overlaid on the replay trajectory (black arrowhead line) indicate the Bayesian-decoded positions (see STAR Methods), with the color denoting relative time within the replay event. Bottom: ripple-filtered LFP and the sequential SWR spiking of place cells. (iii) Bayesian reconstructions of the decoded behavioral trajectories. See also Figure S3 for additional examples for replay of past and future paths.
(F) At the center well, inbound (past paths) and outbound trajectories (future paths) were preferentially replayed in a reverse and forward order, respectively. At the side wells, outbound (past) and inbound trajectories (future) were preferentially replayed in a reverse and forward order, respectively. ****p < 1e-4, session-by-session rank-sum paired test. Error bars: SEM.
(G) The bias in (F) is consistent in each rat (circles; n = 6).
(H and I) The bias in (F) at the center (H) and side (I) wells appeared similarly across all 8 behavioral sessions (E1–8). n.s.: non-significant (Center well: main effect of group, p = 0.52 and 0.44 for inbound and outbound, respectively; Side wells: main effect of group, p = 0.30 and 0.59 for inbound and outbound, respectively; Kruskal-Wallis tests). ****p < 1e-4, session-by-session rank-sum paired test.
(J) Patterns of reverse and forward replay can discriminate goal-locations (n = 3 wells). The cross-validated decoder using SVM is significantly better than chance (error bars) defined by permutation tests (****p < 0.0001; See STAR Methods). Only correct trials were used for (A-J).
(K) Comparison of well-prediction accuracy for correct and incorrect future outbound trials originating at the center well. Error bars indicate 95% confidence intervals based on bootstrapped data (n.s., p = 0.06; **p = 0.01).
See also Figures S3–S4, and Table S2.

