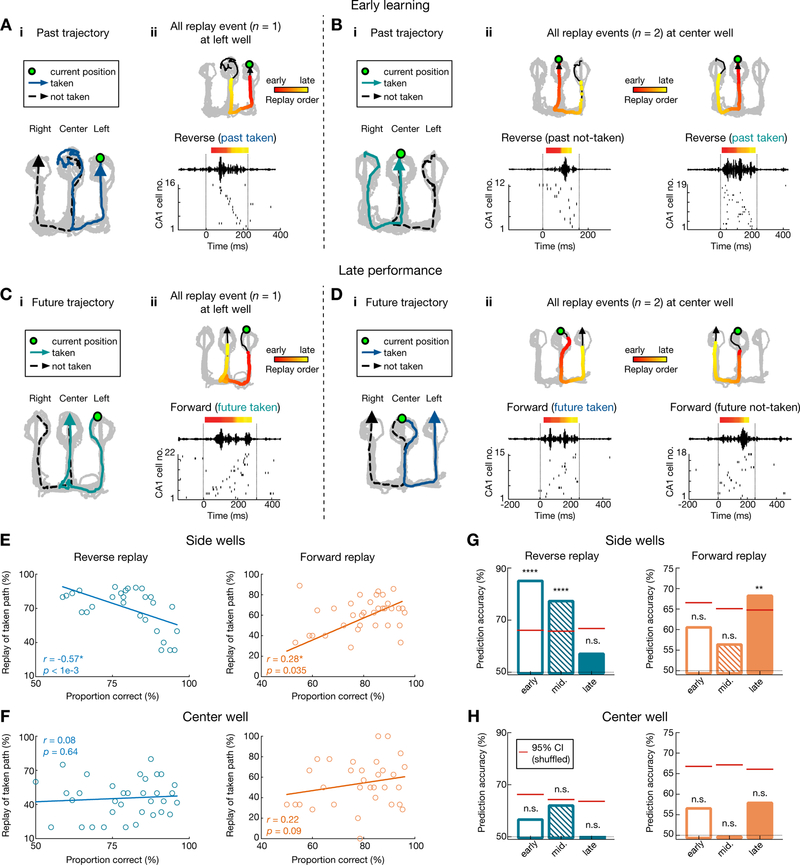
Figure 5. Contrasting evolution of reverse and forward replay during the course of learning.
(A and B) Example reverse replay events during early learning at (A) the side well and (B) the center well. Data are presented as in Figure 3.
(C and D) Example forward replay events during late performance at (C) the side well and (D) the center well. See also Figure S3 for additional examples.
(E and F) Relationship between task performance and fraction of reverse replay of past taken paths (left), or forward replay of future taken paths (right) at (E) the side wells and (F) the center well. Each dot represents one session from a subject. Note the significant negative correlation for reverse replay (r = −0.57*, p < 0.0001) and positive correlation for forward replay (r = 0.28*, p = 0.035; permutation tests) at the side wells, but not the center well (r = 0.08, p = 0.64 for reverse replay; r = 0.22, p = 0.09 for forward replay).
(G) At side wells, reverse replay events predict taken past paths during early learning sessions (left), while forward replay events predict future taken paths during late performance sessions (right). Cross-validated SVM decoders were trained during early, middle and late sessions (sessions 1–3, 4–5, and 6–8, respectively). Significant prediction power was only observed during early and middle sessions for reverse replay (left; p < 0.0001****, 0.0001****, and = 0.43 for early, middle, and late sessions, respectively), and late sessions for forward replay (right; p = 0.23, 0.35, and 0.003** for early, middle, and late sessions, respectively).
(H) Taken paths cannot be predicted from patterns of replay events at the center well (p = 0.36, 0.08, and 0.68 for reverse replay, p = 0.38, 0.56, and 0.15 for forward replay during early, middle, and late sessions, respectively). Red horizontal lines on columns represent chance levels calculated by permutation tests.
Only correct trials are shown. See also Figure S6.

