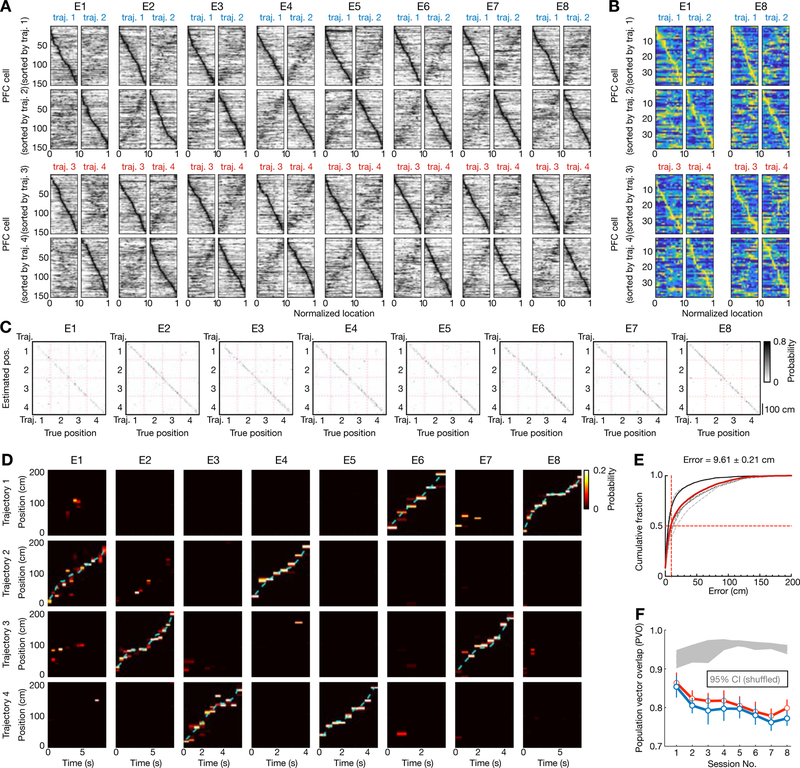
Figure 6. Spatial coding and distinct representations of behavioral trajectories by prefrontal ensembles.
(A) Spatial maps of all PFC cells (n = 154) recorded from 6 rats continuously across 8 learning sessions (E1–8). Data are presented as Figure 1C. Note that mirror-image patterns between pairs of trajectories on each row reflect path equivalent properties of PFC neurons (Yu et al., 2018).
(B) Spatial maps of all PFC cells (n = 38) recorded from an example animal in the first and last sessions.
(C-D) Position reconstruction based on PFC ensemble spiking from the example animal in (B) during active running. Decoding performance was estimated using a leave-one-out cross-validation. (C) Confusion matrices (estimated vs. true position). (D) Estimated position probabilities. Cyan line: actual animal trajectory. Data are presented as Figures 1D–E.
(E) Cumulative PFC decoding errors across all animals (n = 6 rats). Dashed lines: individual animals; Red line: all animals; Solid black line: the example animal shown in (B-D). Median error of all sessions (vertical red line) noted on top. Decoding error: 14.58 ± 0.63 cm for Session 1, 8.99 ± 0.57 cm for Session 8 (in median ± SEM).
(F) Population vector overlap (PVO) of PFC population activity in two running directions across 8 learning sessions. Data are presented as in Figure 1H. Note that the spatial maps of PFC population in two running directions became less similar across sessions, but distinct templates for each direction were apparent in the first session (p’s < 0.0001 compared to the shuffled data for individual rats, trial-label permutation tests).
See also Figure S7.

