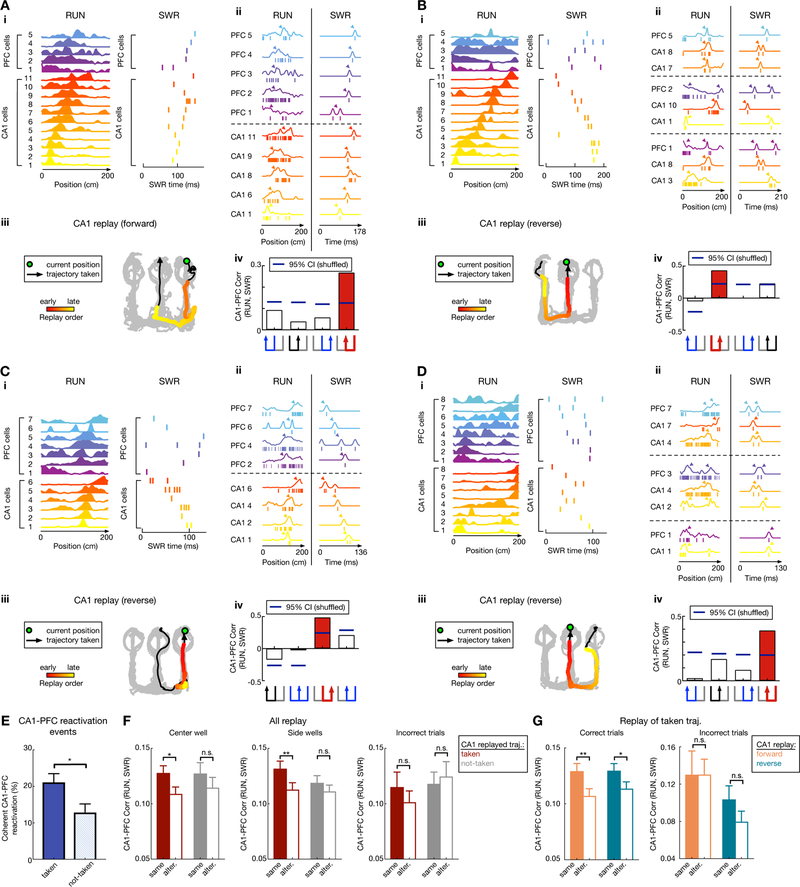
Figure 7. Coherent hippocampal-prefrontal (CA1-PFC) replay of past and future trajectories.
(A-D) Four examples of coherent CA1-PFC reactivation of future and past taken paths. (i) Linearized CA1-PFC spatial-map template with cell IDs on y-axis (left), and the corresponding raster plot during the SWR (right). (ii) Detailed view of CA1-PFC coordination during RUN and the SWR using example cells. Left (RUN): the spiking pattern from a single running trial (ticks) with linearized spatial maps obtained by averaging over all trials (overlaid lines). Right (SWR): spikes (ticks) during the SWR, and the response curves (overlaid lines) created by smoothing observed spikes with a Gaussian kernel. Arrowheads indicate the peak locations. (iii) CA1 trajectory replay, with data presented as in Figure 5A. Green circle: animal’s current position; Black arrowhead line: trajectory taken; Colored dots: decoded CA1-replay path. (iv) Reactivation strength, measured as the correlation coefficient of CA1-PFC activity during RUN vs. SWR using template matching, for four possible trajectories (trajectory schematic on the bottom; red for CA1-replayed path, black for alternative path, blue for the other paths). Blue horizontal lines on columns represent 95% confidence intervals computed from shuffled data (SWR spike time shuffle). Selected PFC cells with highest contribution to the reactivation strength are shown for ease of presentation, illustrating the synchronized firing pattern for CA1-PFC cells during RUN, which is reactivated during the SWR event.
(E) The proportion of coherent CA1-PFC reactivation events during correct trials is significantly higher during CA1 replay of taken vs. not-taken trajectories (p = 0.02*, session-by-session rank-sum paired test).
(F) Paired comparison of CA1-PFC reactivation strength for CA1-replay of taken vs. alternative path during correct trials at center (Left) and side (Middle) wells, and for incorrect trials (Right). Note that during correct trials, CA1-PFC reactivation strength is significantly higher for the CA1-replayed path compared to its alternative (alter.), only when this replayed path was the behaviorally taken path at both center (p = 0.032*; n = 246 and 110 replay events for taken and not-taken respectively) and side wells (p = 0.0075**; n = 244 and 212 replay events for taken and not-taken respectively), but not when the CA1-replayed path was the “not-taken” path ( p = 0.35 and 0.16 for side and center wells, respectively; event-by-event rank-sum paired tests). This bias of CA1-PFC reactivation during correct trials is absent during incorrect trials (n = 49 and 56 replay events, and p = 0.20 and 0.96 for taken vs. not-taken respectively; event-by-event rank-sum paired tests).
(G) Left: Stronger CA1-PFC reactivation of taken path compared to not-taken path during correct trials for both forward and reverse CA1 replay (p = 0.0058** and n = 215 events for forward replay of taken path; p = 0.039* and n = 275 events for reverse replay of taken path; event-by-event rank-sum paired tests). Right: During incorrect trials, CA1-PFC reactivation did not show significant difference for taken vs. alternative path for either forward or reverse CA1 replay (p = 0.96 and n = 21 events for forward replay of taken path; p = 0.10 and n = 28 events for reverse replay of taken path; event-by-event rank-sum paired tests).
See also Figures S7 and S8.

