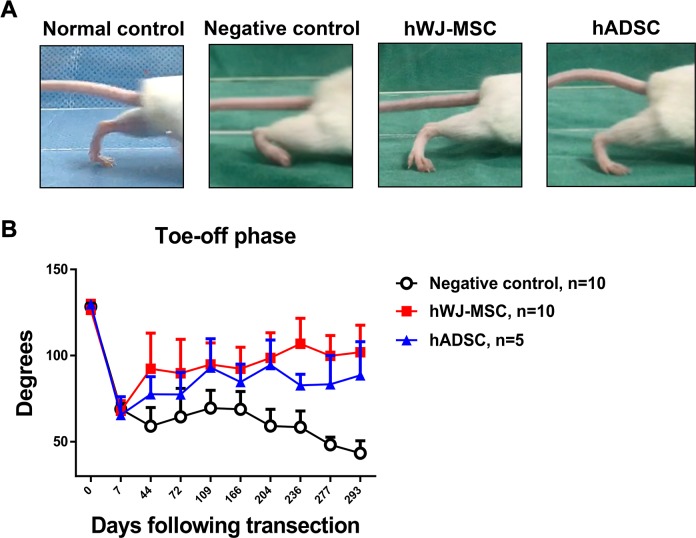
Figure 2.
Video gait analysis and measurement of gait angles. (A) Photographs of mouse gait angles at the toe-off phase of the gait cycle at 236 days postoperatively in normal control, negative control, hWJ-MSC, and hADSC. The same number of stem cells (5 × 10⁵) was added in both hWJ-MSC and hADSC groups at postoperative day 0. (B) Angles were measured in the negative control, hWJ-MSC, and hADSC groups for up to 293 days following transection surgery. The mean ± SD of the negative control, hWJ-MSC, and hADSC groups were 68.9 ± 3.4°, 68.0 ± 5.8°, and 65.5 ± 10.6°, respectively, at POD 7. The mean ± SD of the negative control, hWJ-MSC, and hADSC groups were 59.1 ± 10.8°, 92.4 ± 20.6°, and 77.5 ± 10.3°, respectively, at POD 44. The mean ± SD of the negative control, hWJ-MSC, and hADSC groups were 58.5 ± 9.3°, 106.8 ± 14.9°, and 82.8 ± 6.4°, respectively, at POD 236. Comparison of mean ± SD of the negative control with hWJ-MSC and hADSC groups showed a significant difference (p = 0.0008, one-way ANOVA; negative control vs. hWJ-MSC, p = 0.0030; negative control vs. hADSC, p = 0.0048; hWJ-MSC vs. hADSC, p = 0.0149; Tukey’s test). The average angle of the normal mouse group was 128.0° ± 0.8376°.

