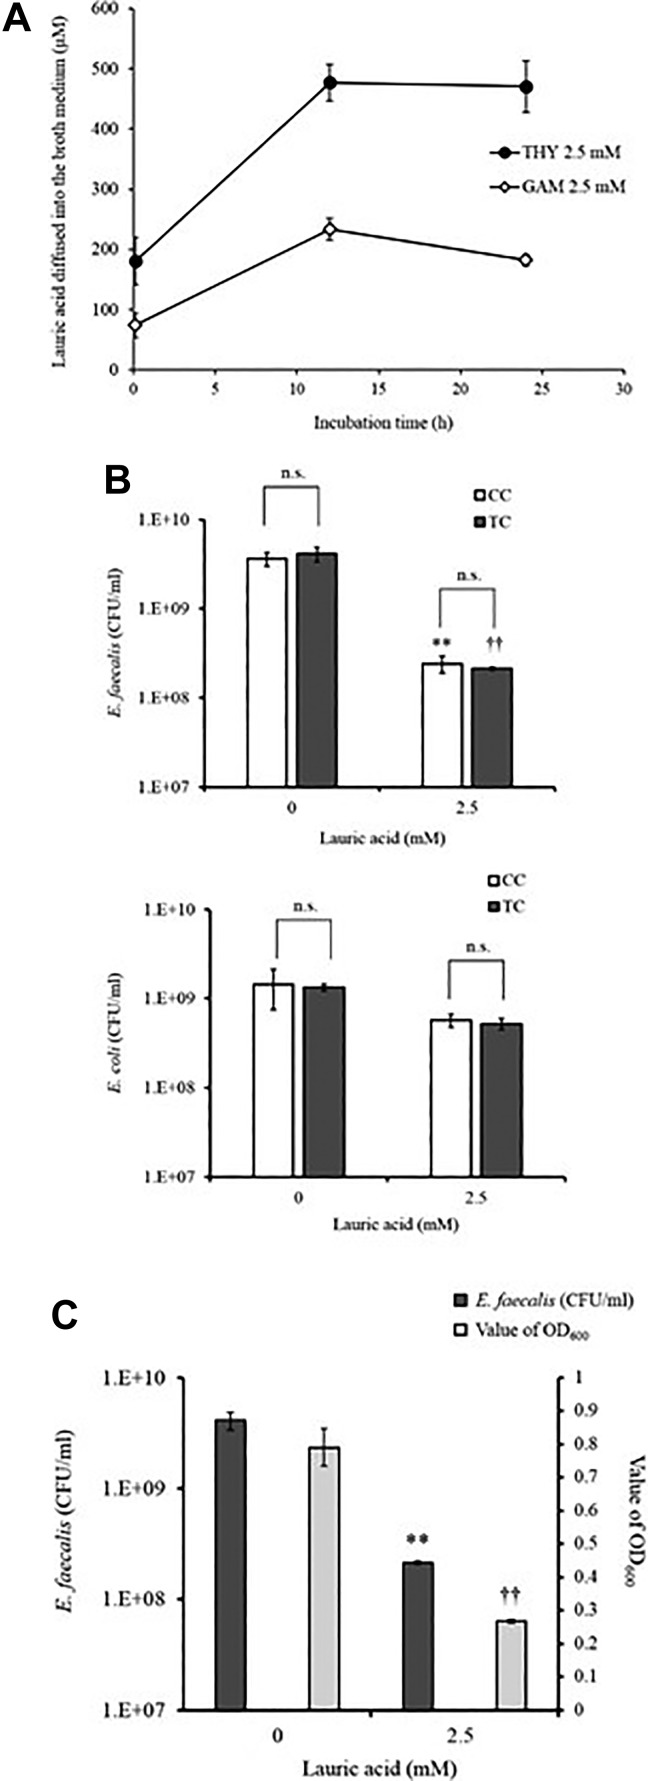
Figure 7.
LA content in the top layer and antimicrobial activity in GAM. (A) LA with 2.5 mM concentrations was added to the bottom layer of the TC and incubated at 37°C. Then, at 10 min, 12 h, and 24 h, the upper portion was harvested, and the amount of LA in the medium was measured. Closed circles are for THY 2.5 mM, and open circles are for GAM 2.5 mM. (B) LA was added at 0 and 2.5 mM in both complexes and incubated at 37°C for 12 h. Thereafter, the complex was gently mixed, and E. faecalis and E. coli (0.3–1×10⁷ CFU) were added to the top layer. After incubation at 37°C for 12 h, the number of bacterial colonies in the top layer was counted using the colony counting method. Panel C shows the correlation between the numbers of E. faecalis by the colony count method and the OD600 values in TC. Data are presented as mean ± SEM of six samples (two independent experiments performed in triplicate). **p < 0.05 compared with the white-colored bar data at LA 0; †† p < 0.05 compared with the black-colored bar data at LA 0; n.s., not significant.

