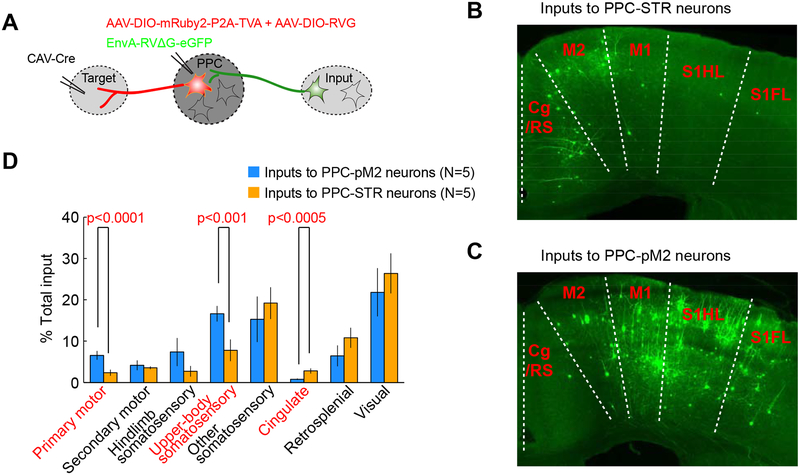
Figure 2. PPC-STR and PPC-pM2 neurons receive distinct distributions of long-range cortical inputs.
A. Schematic of projection-specific, retrograde monosynaptic tracing.
B. A coronal section showing long-range cortical inputs to PPC-STR neurons. The anterior-posterior distance from bregma is indicated on the lower left corner. Cg/RS: cingulate/retrosplenial complex (transitional zone posterior to cingulate and anterior to retrosplenial cortex). M2: secondary motor cortex. M1: primary motor cortex. S1HL: primary somatosensory cortex hindlimb region. S1FL: primary somatosensory cortex forelimb region.
C. A coronal section showing long-range cortical inputs to PPC-pM2 neurons.
D. Quantification of dorsal cortical inputs to PPC-STR vs. PPC-pM2 neurons (N = 5 mice each). The y-axis represents the percentage of inputs, normalized to the total inputs in each mouse. Mean ± S.E.M. across 5 mice. BTS test.

