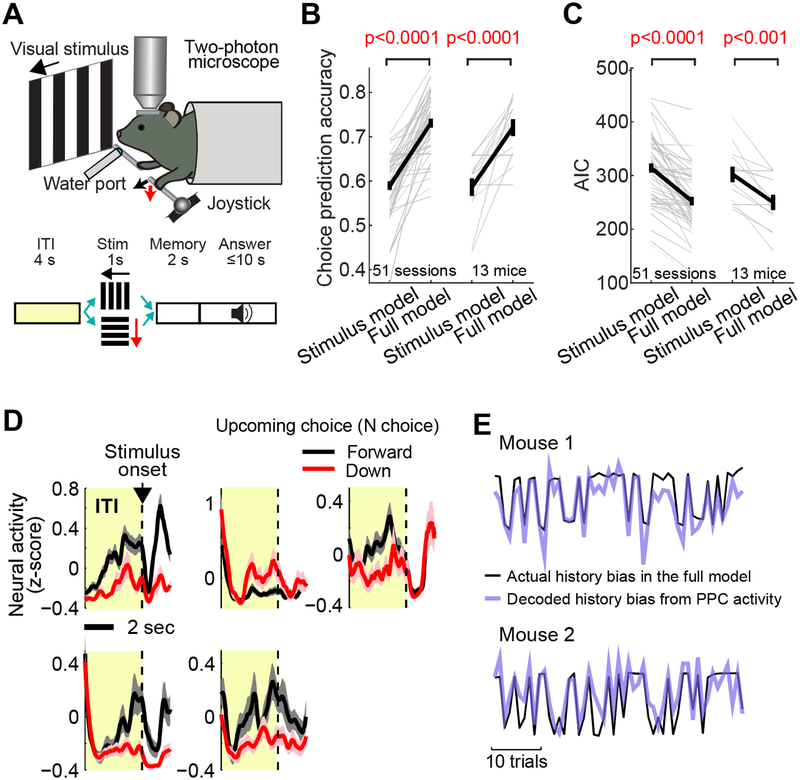
Figure 3. PPC neurons represent history bias in two-choice task.
A. Schematic of the two-choice joystick task.
B. The choice prediction accuracy of stimulus model vs. full model across 51 imaging sessions (left, green) in 13 mice (right, black). The stimulus model uses stimulus and constant as predictors, and the full model uses stimulus, constant, and history information. Thin lines: individual sessions or mice. Thick lines: mean ± S.E.M. BPS test. History has a significant impact on choice.
C. The Akaike information criteria (AIC) of stimulus model vs. full model across 51 sessions (left) in 13 mice (right). BPS test. The smaller the AIC, the better the prediction.
D. The mean activity of example neurons in PPC during the inter-trial interval (ITI) and stimulus period of the two-choice task. Black: mean ± S.E.M. across all forward choice trials in one imaging session (202 for the top three neurons and 65 for the bottom two neurons). Red: mean ± S.E.M. across all downward trials in the same session (65 and 137 for the top and bottom row neurons, respectively). These neurons show tuning to the upcoming (N) choice during the ITI (i.e., N-choice tuning).
E. Example traces of trial-by-trial history bias estimated from the full model (black; Equation 3) and a lasso regression fit (purple, cross-validated) by the ITI activity of a population of PPC neurons, indicating that the PPC population represents the history bias. In the lasso regression, history bias in each trial was decoded from a weighted sum of the ITI activity of all imaged PPC neurons (STAR Methods).

