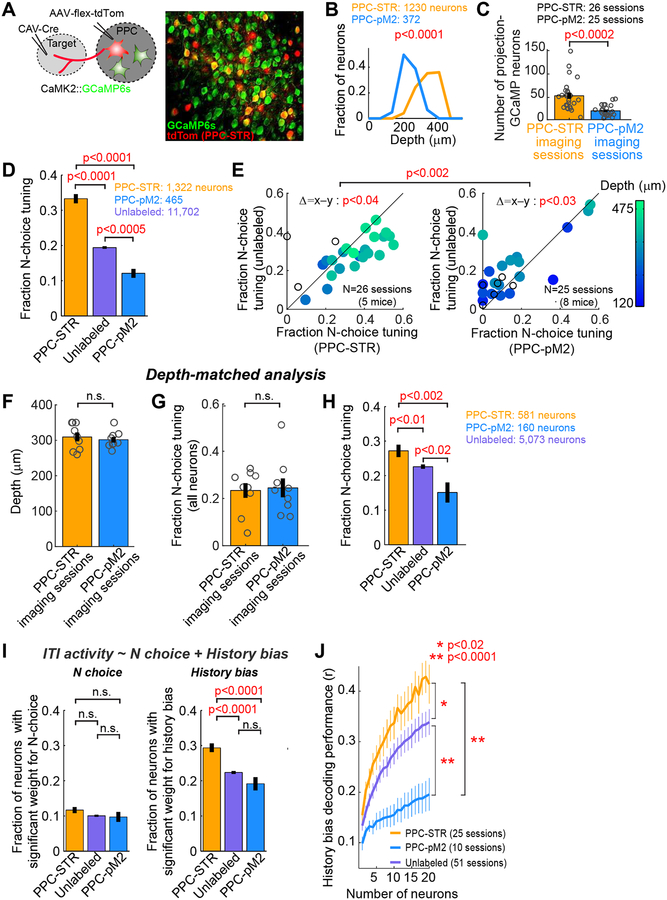
Figure 4. History bias is preferentially encoded by PPC-STR neurons.
A. PPC-STR or PPC-pM2 neurons were retrogradely labeled with tdTomato in mice expressing GCaMP6s in excitatory neurons. Right: an example PPC imaging field.
B. Histograms of the fractions of imaged projection neurons along cortical depth. Orange: PPC-STR neurons. Blue: PPC-pM2 neurons. BTS test. PPC-STR neurons tend to reside in deeper layers than PPC-pM2 neurons.
C. The number of neurons that were retrogradely labeled and showed detectable GCaMP signals in the field of each imaging session (1 field / session). Circles: individual sessions (26 PPC-STR and 25 PPC-pM2 sessions from 5 and 8 mice, respectively). Black line: mean ± S.E.M. across sessions. BTS test.
D. The fraction of neurons that are significantly tuned to the upcoming choice during the ITI (N-choice tuning) for PPC-STR, unlabeled, and PPC-pM2 neurons. Data were pooled across animals. Error bar: S.E. χ2 test. PPC-STR neurons are more likely tuned to N choice than PPC-pM2 and unlabeled neurons.
E. Within-session comparison of the fraction of N-choice tuning during the ITI; PPC-STR vs. unlabeled population (left) or PPC-pM2 vs. unlabeled population (right). Each dot: single session (1 field / session). The imaging depth of each session is color coded. Open dots: sessions with no depth information. BPS test on the fraction of N-choice tuning between projection and unlabeled neurons. BTS test on differences in the fraction of N-choice tuning (projection – unlabeled) between the two projection groups.
F. A subset of imaging sessions were selected in which the imaging depths were between 250 and 350 m to match the depths between the two projection groups (N = 9 sessions per group). Circles: individual sessions. Black line: mean ± S.E.M. across sessions. BTS test.
G. Depth-matched comparison of the fraction of neurons with N-choice tuning during the ITI in the general population of PPC neurons between the depth-matched PPC-STR vs. PPC-pM2 imaging sessions. All GCaMP6s-positive neurons were included in this analysis regardless of tdTomato expression. Circles: individual sessions. Black line: mean ± S.E.M. across sessions. BTS test. The responses of all imaged neurons are similar between the two depth-matched imaging groups.
H. Depth-matched comparison of the fraction of neurons with N-choice tuning during the ITI in three PPC subpopulations, PPC-STR, unlabeled, and PPC-pM2 neurons. Data from the depth-matched sessions were pooled across animals. Error bar: S.E. χ2 test. Even when the depths were matched, PPC-STR neurons are more likely tuned to N choice than unlabeled and PPC-pM2 neurons.
I. The fraction of neurons whose ITI activity showed significant weights for N choice (left) or history bias (right) in a multiple linear regression. Data were pooled across animals. Error bar: S.E. χ2 test. PPC neurons, especially PPC-STR neurons, encode history bias more preferentially than N choice.
J. The estimated trial-by-trial history bias (Equation 3) was decoded from the ITI activity of each neuronal population, similar to Figure 3E (STAR Methods). Decoder performance was measured as the Pearson’s correlation coefficient between the decoded bias and actual bias. The number of neurons in three populations was matched by subsampling (1 to 20 neurons). For each projection population, only the sessions with at least 20 projection neurons were included. Mean ± S.E.M. across sessions. BTS test on the average across all population sizes. History bias is encoded preferentially by PPC-STR neurons.

