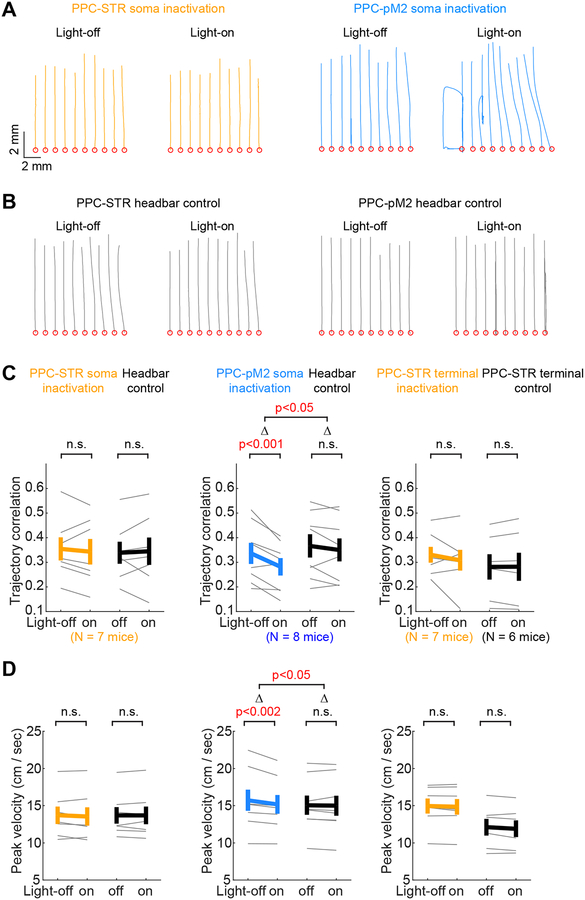
Figure 6. Inactivating PPC-pM2 neurons alters movement kinematics.
A. Trajectories of movements from movement onset to the target (forward), in example PPC-STR versus PPC-pM2 soma inactivation sessions. Thin lines: 10 trials in each light condition. Red circles: the origin of movements.
B. The same as A, but for example headbar control sessions.
C. Trial-to-trial correlation of movement trajectories on light-off vs. light-on trials (STAR Methods). The higher the correlation coefficient, the more consistent/similar the movements. The same sessions used for the analysis of history dependence (Figure 5) were subjected to kinematic analysis. Left: PPC-STR soma inactivation group (N = 7 mice). Middle: PPC-pM2 soma inactivation group (N = 8 mice). Right: PPC-STR axon terminal inactivation (N = 7 mice) group and control group (N = 6 mice). BPS tests were applied to all within-group comparisons (light-off vs. light-on). For between-group comparisons (inactivation vs. control), BPS test in soma inactivation groups, and BTS test in terminal groups. Thin lines: individual mice. Thick lines: mean ± S.E.M. across mice. Inactivation of PPC-pM2 neurons reduced trial-to-trial consistency of movement trajectories.
D. The same as C, but for the peak velocity of movements. Inactivation of PPC-pM2 neurons reduced the peak velocity of movements.

