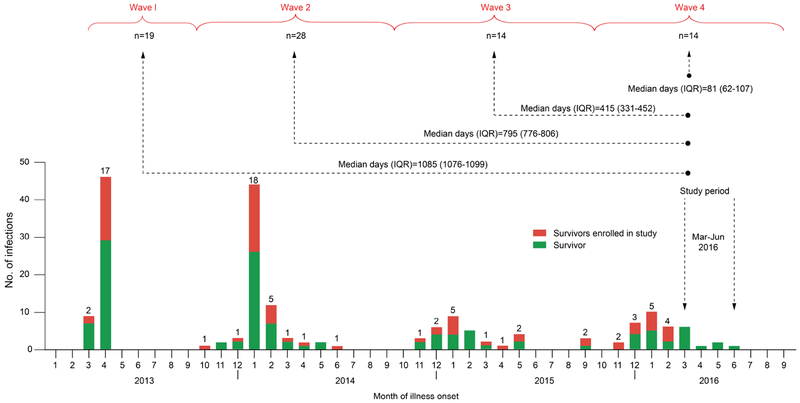
Figure 1. Diagram of study population.
Temporal distribution of laboratory-confirmed human cases of avian influenza A(H7N9) virus infection in Zhejiang, Jiangsu, and Shandong Provinces, China, during the first four epidemic waves is shown by month. The monthly numbers of H7N9 survivors (defined by symptom onset month) enrolled in the present study from each Wave (Wave 1: February-September 2013, Wave 2: October 2013-September 2014, Wave 2: October 2014-September 2015, Wave 4: October 2015-September 2016) are shown in red, together with non-enrolled survivors (in green). Arrows between study enrollment and each Wave represent the median duration (interquartile range, IQR) of days from illness onset to enrollment collection of blood samples. The number of enrolled patients is shown by month (on the top of each bar) and by epidemic Wave (under each curly bracket).

