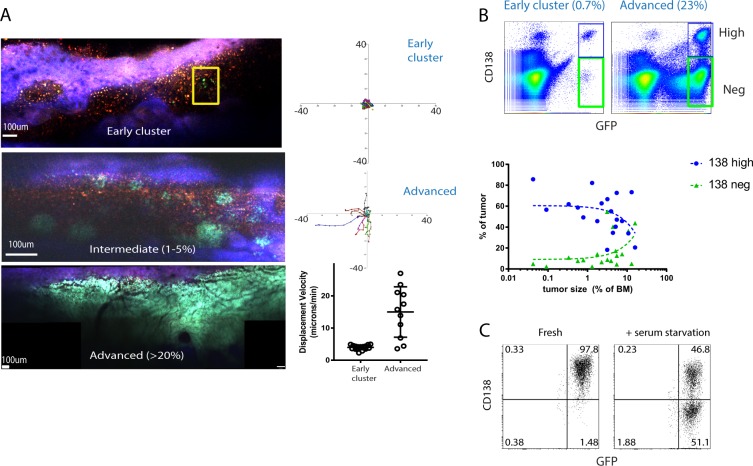
Fig. 1.
CD138 expression and cell motility changes with tumor burden. a Intravital two-photon imaging of GFP+ (green) Vk*myc myeloma cells in the tibia at various tumor burdens (early, intermediate, and advanced stages) with analysis of individual cell track trajectories of total GFP+ myeloma cells in the BM, arrested at early stage cluster (yellow box in (a)) and representative migrating cells taken from advanced stage (>20% tumor burden) using mixed tumor of GFP+ and GFP-clones. b Representative dot plots of CD138 expression on myeloma cells (gated in black) at low and high tumor burden and overall trends in CD138-high and negative subsets plotted over various tumor sizes. c Comparison of CD138 expression on GFP+ myeloma cells either freshly isolated from BM, or after 1 h serum starvation (representative plot)

