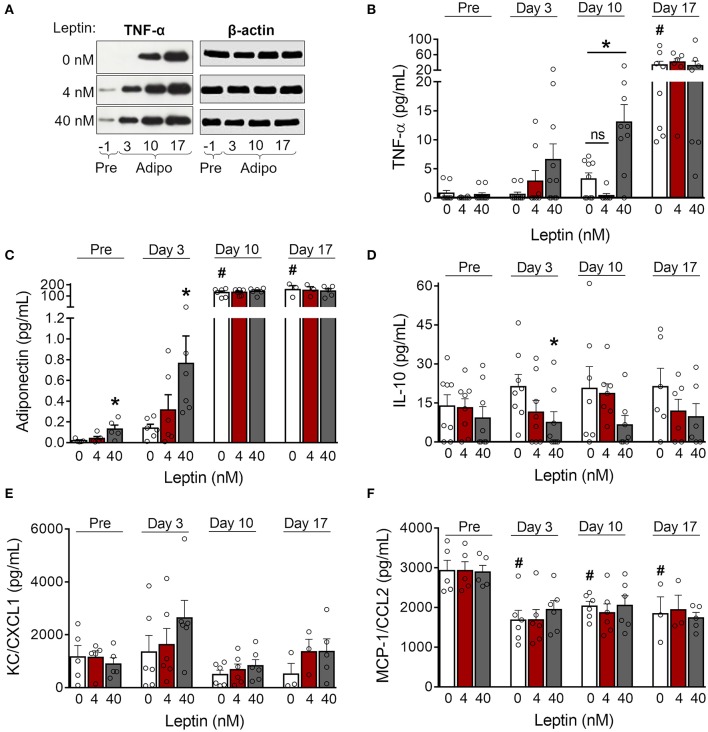
Figure 3.
Leptin induces a proinflammatory cytokine profile during adipocyte differentiation. (A,B) 3T3-L1 preadipocytes (day−1) and adipocytes at days 3, 10, and 17 were cultured in the presence of leptin (0, 4, or 40 nM). (A) Western blot analysis of TNF-α and β-actin in cell lysates from each condition. Blots are representative of three independent experiments. Cell lysates from a representative experiment were analyzed in the same gel and cropped for clearer comparison among the groups. (B–F) Concentration of (B) TNF-α, (C) adiponectin, (D) IL-10, (E) KC/CXCL1, and (F) MCP-1/CCL2 in the supernatant of preadipocytes and adipocytes differentiated under distinct leptin stimulus. Bars represent mean ± standard error of the mean of 3–11 independent experiments. #p < 0.05 compared to preadipocytes (day−1). *Represents p < 0.05 between leptin-treated and untreated cells at the same stage of differentiation. Statistical analyzes were performed by using (B–E) One-way ANOVA followed by Kruskal-Wallis' test with Dunn's correction or (F) One-way ANOVA with Dunnet's post-test. “ns” stands for non-significant.

