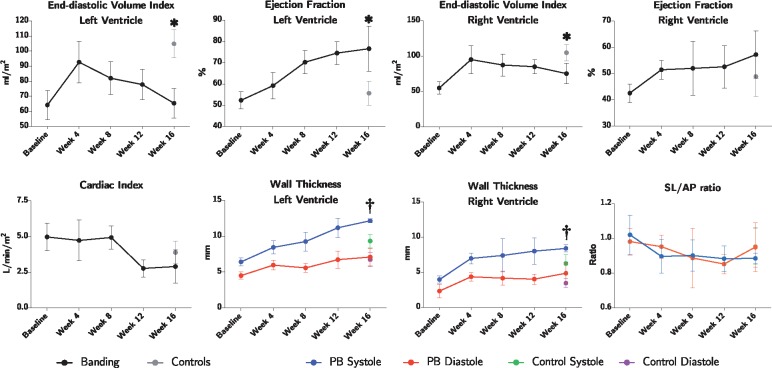
Figure 5.
Results of magnetic resonance imaging. Data plotted as means with whisker bars representing 95% confidence interval. PB, pulmonary banding; SL/AP, septum-lateral/anterior-posterior ratio of the left ventricle. *Statistically significant difference between the intervention and control group at Week 16. †Statistically significant one-way ANOVA between groups at 16 weeks.

