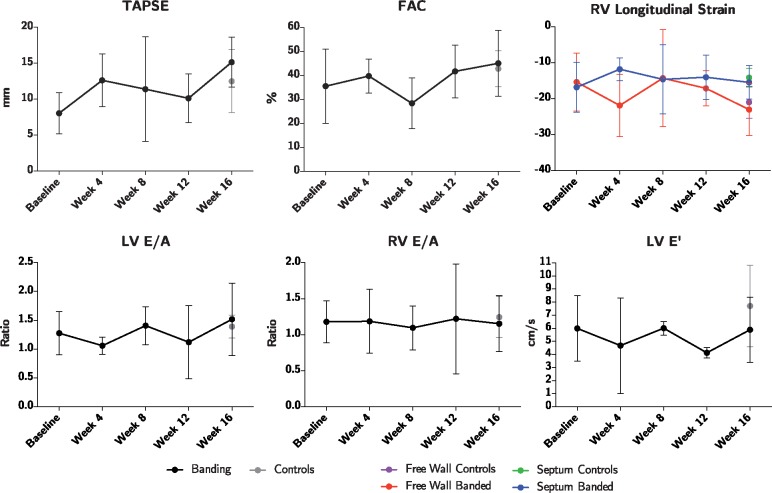
Figure 6.
Assessment of cardiac function by echocardiography. Strain is assessed in both the right ventricular free wall, and in the septum. Animals subjected to pulmonary banding (black) are compared with the endpoint control group (grey). Data plotted as means with whisker bars representing 95% confidence interval. FAC, fractional area change; LV, left ventricle; RV, right ventricle; TAPSE, tricuspid annular plane systolic excursion.

