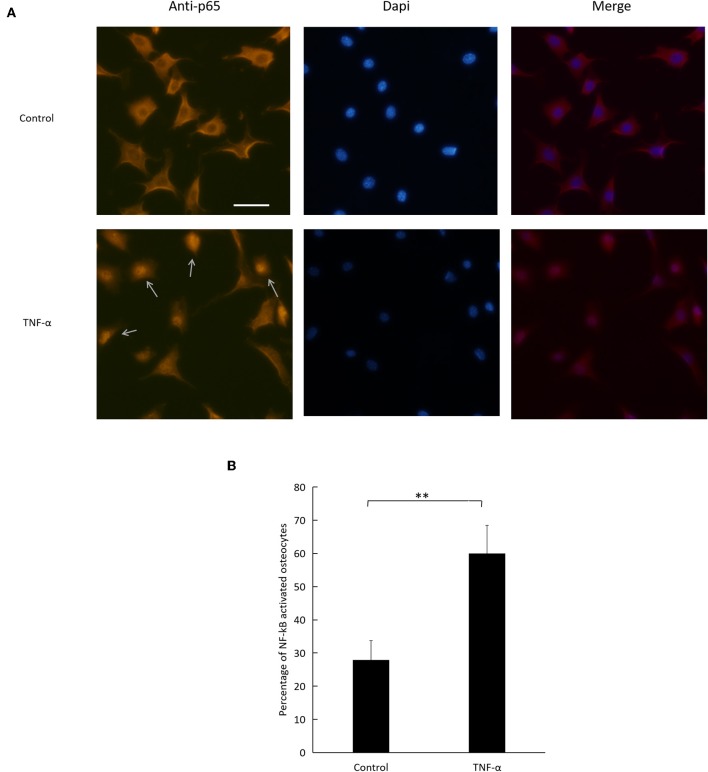
Figure 7.
Effect of TNF-α on NF-κB pathway activation. (A) Fluorescent images of osteocytes cultured with or without TNF-α and stained for NF-κB p65 subunit. Arrows indicate NF-κB activated osteocytes. (B) Number of NF-κB activated osteocytes to total number of osteocytes imaged. Scale bar = 50 μm. Data are expressed as mean ± SD. Statistical significance was determined by t-test (n = 4, **P < 0.01). Images were processed in Image J software.

