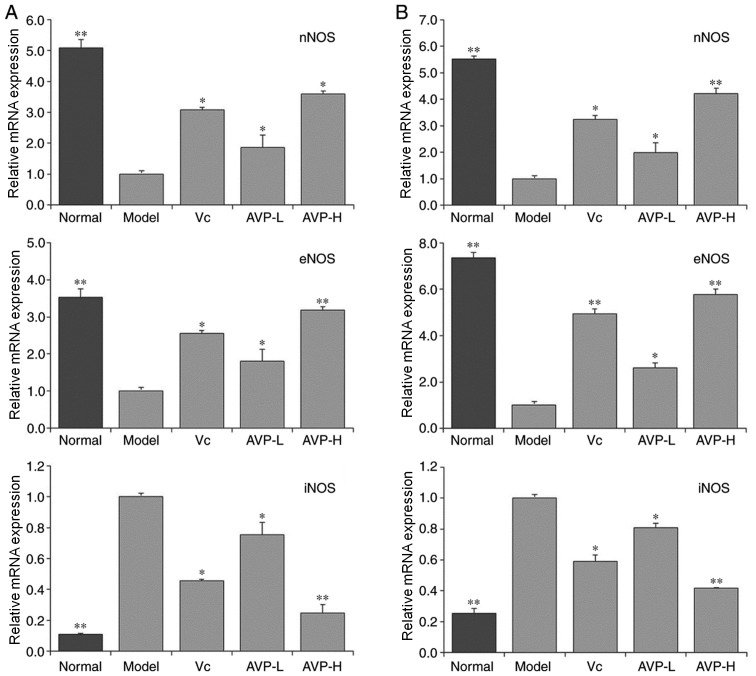
Figure 7.
nNOS, eNOS and iNOS mRNA expression in the (A) liver and (B) spleen of mice. *P<0.05 and **P<0.01 vs. the model group. Vc, mice treated with 100 mg/kg Vc; AVP-L, mice treated with a low concentration (50 mg/kg) of AVP; AVP-H, mice treated with a high concentration (100 mg/kg) of AVP. AVP, Apocynum venetum polyphenol extract; eNOS, endothelial NOS; iNOS, inducible NOS; nNOS, neuronal NOS; NOS, nitric oxide synthase; Vc, vitamin C.

