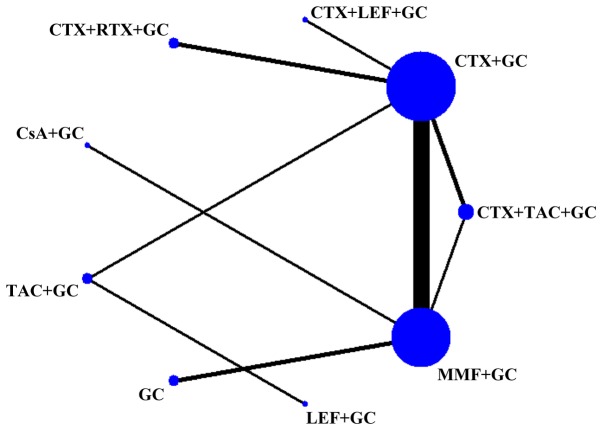
Figure 2.
Network diagram of evidence for treatment efficacy of each regimen. The size of each node is proportional to the sample size of the individual treatment regimen; the widths of the connecting lines are proportional to the number of studies compared between the two regimens. GC, glucocorticoid; CTX, cyclophosphamide; MMF, mycophenolate; TAC, tacrolimus; LEF, leflunomide; RTX, rituximab; CsA, cyclosporine A.

