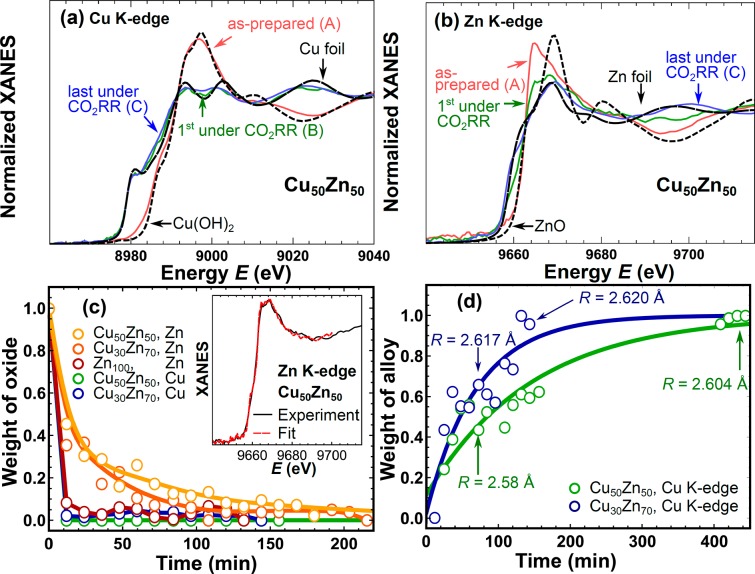
Figure 4.
Selected (a) Cu K-edge and (b) Zn K-edge XANES spectra of Cu50Zn50 NPs corresponding to as-prepared oxidized samples (spectrum A), samples immediately after the onset of CO2RR conditions (spectrum B) and the final spectrum collected after 7 h under CO2RR conditions (spectrum C). (c) Linear combination analysis results for the Zn K-edge and Cu K-edge of XANES data of Cu50Zn50 and Cu30Zn70 NPs obtained using spectrum A (oxidized sample) and spectrum C (completely reduced sample) as reference. The inset shows a representative linear combination fit (result for Zn K-edge spectrum of Cu50Zn50 NPs immediately after the onset of CO2RR conditions). (d) Linear combination analysis results of Cu K-edge XANES data using spectra B and C as reference, where the latter corresponds to the most alloyed state. Cu-M interatomic distances, as extracted from EXAFS data fitting, are also shown. Solid lines are guides for the eye.

