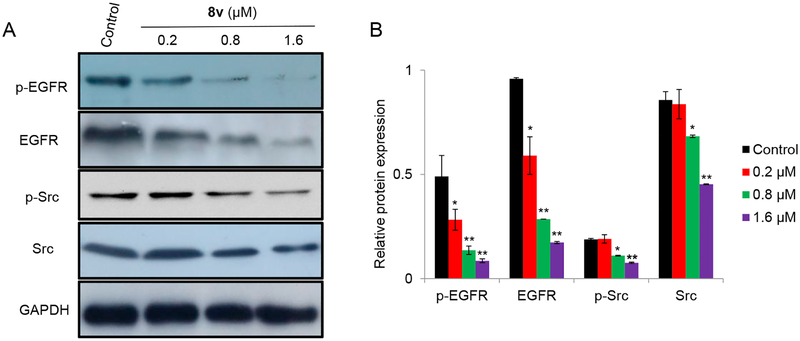
Fig. 4.
(A) Western blotting analysis of the expression of EGFR, p-EGFR, Src and p-Src in K562 cells treated with 0, 0.2, 0.8, or 1.6 μM oxadiazole chalcone hybrid 8v. GAPDH served as a loading control. (B) The protein expression of EGFR, p-EGFR, Src and p-Src after treatment with different concentrations of compound 8v. The values are expressed as the mean ± SD based on three different experiments. *, P < 0.05 and **, P < 0.005 indicate a significant difference compared with vehicle treated cells.

