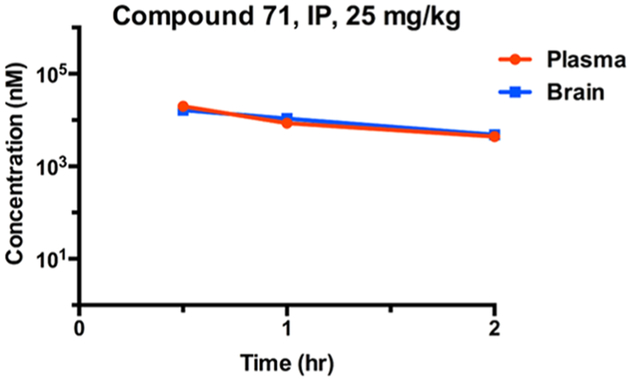
Figure 4.
Mouse pharmacokinetic profile of Compound 71. Compound concentrations were quantified in both plasma (red curve) and brain (blue curve) at 0.5, 1.0, and 2.0 h after a single 25 mg/kg intraperitoneal (IP) administration. Compound concentrations in plasma and brain at each time point are average values from three test mice. The error bars represent ± SEM.

