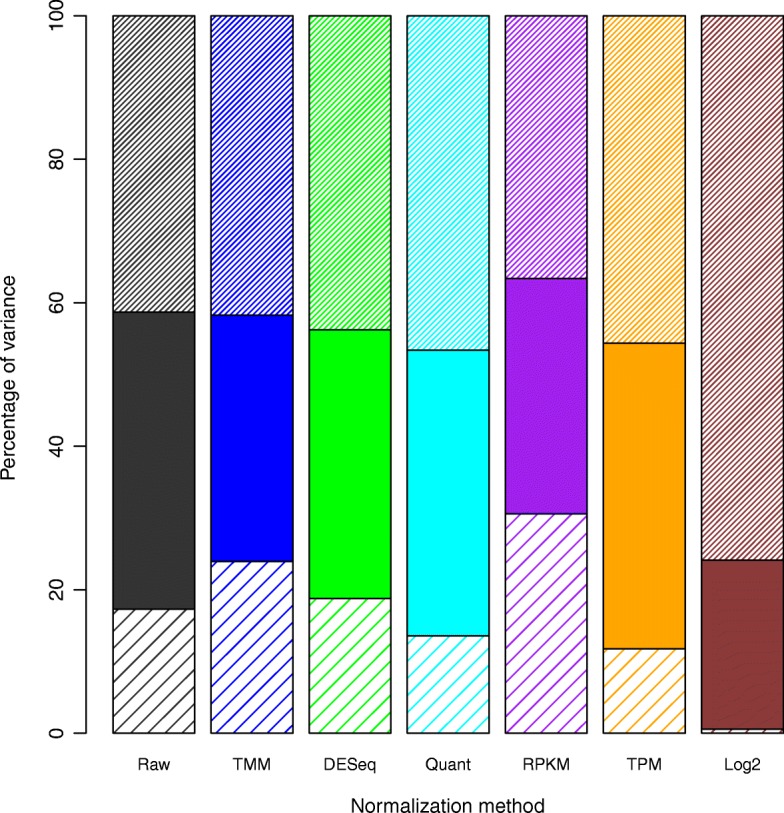
Fig. 1.

Bar Plot of Normalization Methods and their relative errors from a two-way ANOVA. The MSE for each of the features (site and biological condition) can be used to measure the amount of variance attributed to that specific feature. The top narrow striped bar is site dependent variability (batch effects); the solid bar is biological variability; and the bottom, wide striped bar is the residual variability
