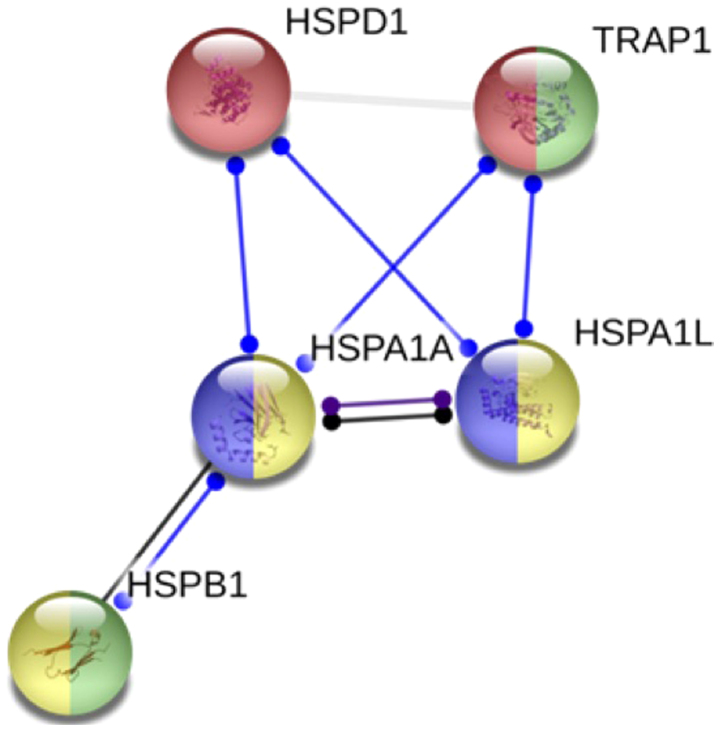
Figure 5.
Gene functional and Network pathway analysis of TRAP1, HSPD1, HSPB1, HSPA1L and HSPA1A. The Gene functional and Network pathway analysis evaluated in silico by STRING database. The circles colors indicate the HSP functions in network. Chaperone mediated protein folding, negative regulated of oxidative stress-induced intrinsic apoptotic signaling pathway (green), MAPK signaling pathway (yellow), and spliceossoma (purple). TRAP1, TNF receptor associated protein 1; HSP, heat shock protein family.

