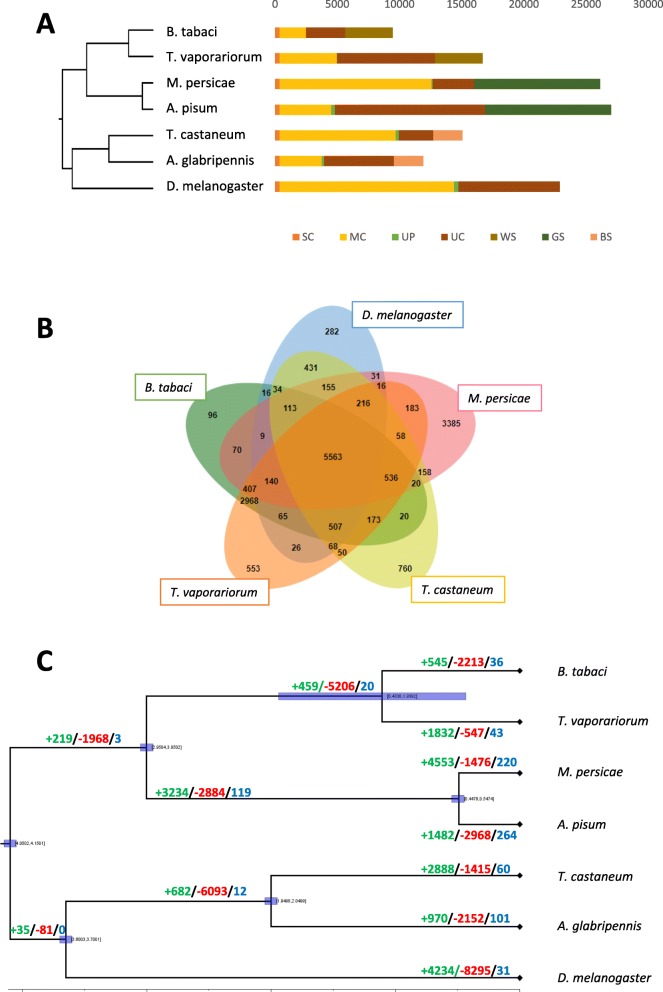
Fig. 1.
Phylogenomic analysis of T. vaporariorum and 6 other arthropod species. a Phylogenetic relationship and gene orthology of T. vaporariorum and other arthropods. SC indicates common orthologs with the same number of copies in different species, MC indicates common orthologs with different copy numbers in different species. UP indicates species-specific paralogs, UC indicates all genes which were not assigned to a gene family, WS, GS and BS indicate clade-specific genes. b Gene families shared by selected species. c Species dated phylogenetic tree and gene family evolution. Numbers on the branch indicate counts of gene families that are expanding (green), contracting (red) and rapidly evolving (blue). The horizontal blue bars correspond to 95% confidence intervals in time estimation based on the lognormal relaxed clock model

