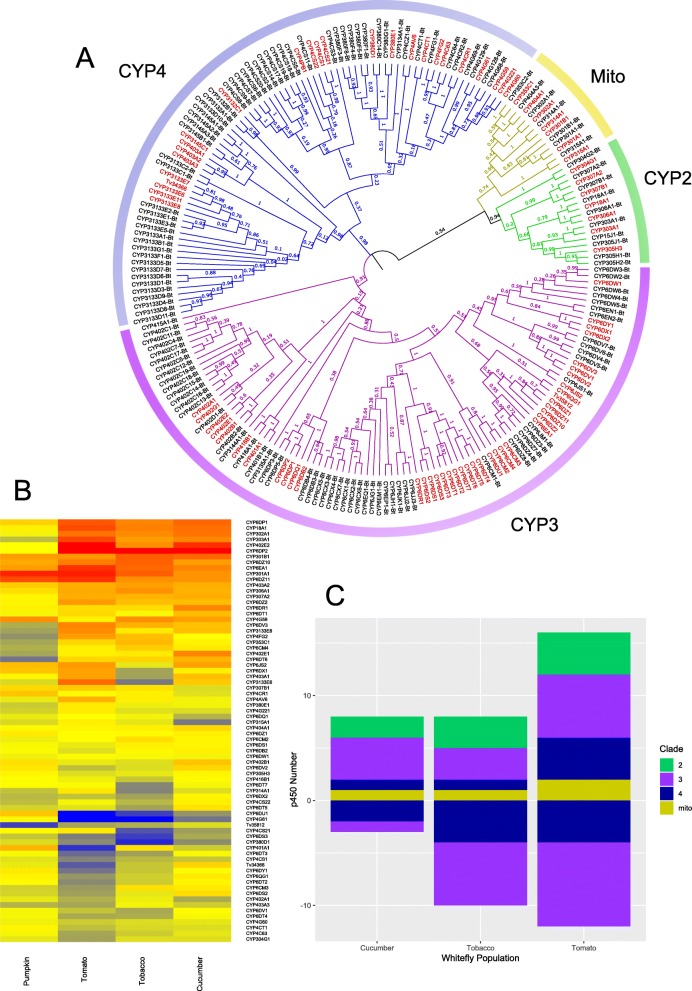
Fig. 2.
The CYPome of T. vaporariorum. a Maximum likelihood phylogeny of the CYPome of B. tabaci (black) and T. vaporariorum (red). Branches are coloured according to clade with bootstrap values from 1000 replicates given as decimals on branches. b Heatmap of log2 expression of full length T. vaporariorum cytochrome P450s in lines reared on tobacco (Nicotiana tabacum), tomato (Solanum lycopersicum), cucumber (Cucumis sativus) and pumpkin (Cucurbita pepo) when compared to a line reared on French bean (Phaseolus vulgaris). c Bar chart indicating numbers of P450s significantly over/under-expressed in the above populations. Bars are divided according to P450 clade

