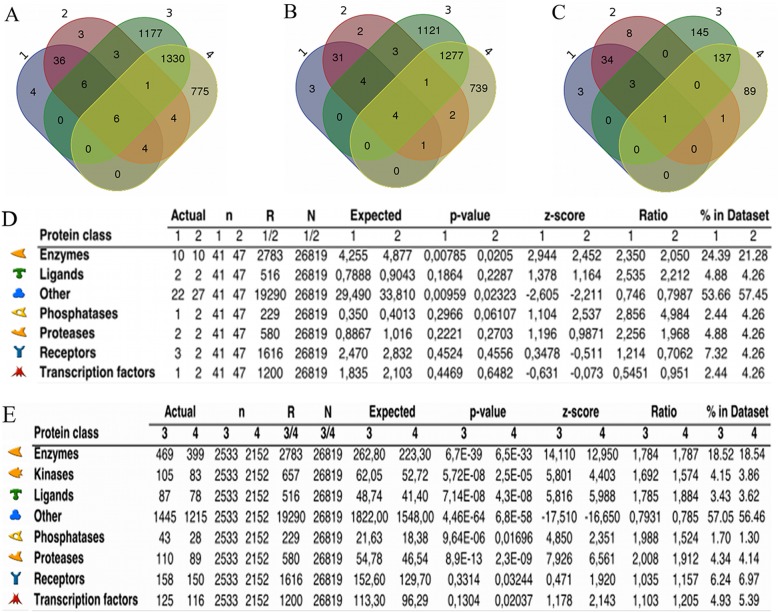
Fig. 1.
Functional enrichment of differentially expressed genes (DEGs) in Braford skin according to host phenotype and tick infestation. Venn diagrams show the distribution of DEGs from inter- (Rpre vs. Spre (1) and Rpost vs. Spost (2)) and intragroup (Rpost vs. Rpre (3) and Spost vs. Spre (4)) comparisons: (a) all DEGs, (b) only the annotated ones, or (c) only annotated TopDEGs. Functional annotation based on protein classes of DEGs from (d) inter- and (e) intragroup comparisons are shown, represented by a symbol following the Metacore® reference guide (https://portal.genego.com/legends/MetaCoreQuickReferenceGuide.pdf). Actual: number of network objects from the dataset(s) for a given protein class; n: number of network objects in the dataset(s); R: number of network objects of a given protein class in the complete database or background list; N: total number of network objects in the complete database or background list; Expected: mean value for hypergeometric distribution (n*R/N); p-value: probability to have the given value of Actual or higher (or lower for negative z-score); z-score: ((Actual-Expected)/sqrt(variance)); Ratio: connectivity ratio (Actual/Expected); % in Dataset: fraction of network objects with a selected function in the dataset

