Fig. 1.
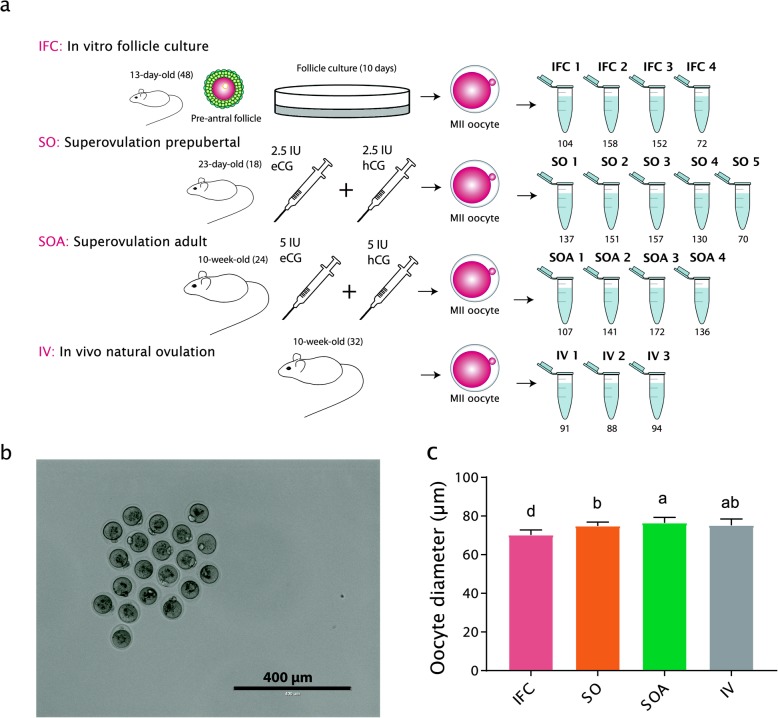
a Experimental groups used for the genome-wide DNA methylation analysis. The number of females used per group is indicated in brackets next to their age. The tubes represent the number of biological replicates and the number under each tube indicates the number of oocytes pooled in each sample. MII metaphase II, eCG equine chorionic gonadotropin, hCG human chorionic gonadotropin. b MII oocytes from IFC obtained after 10 days of culture. Pictures were taken before snap freezing to measure oocyte diameters. c Oocyte diameter per group. Bar charts show the mean and the standard deviation (SD). Lower-case letters denote significant differences (p < 0.05) after applying non-parametric Krustall-Wallis and Dunn’s multiple comparisons tests

