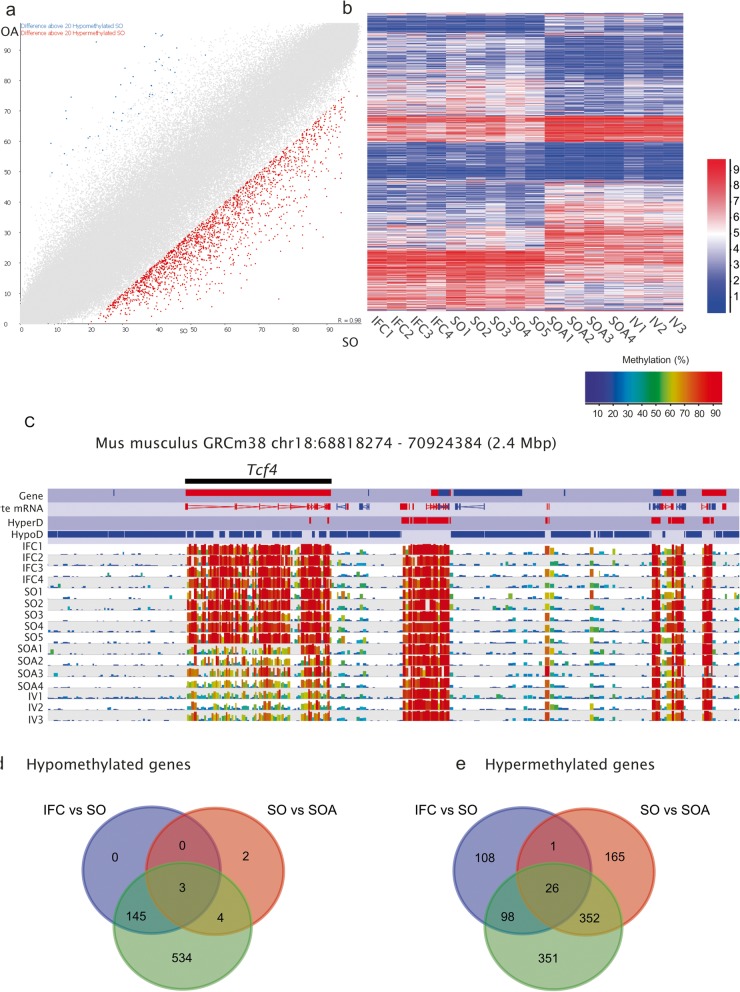
Fig. 4.
a Scatterplot for common informative tiles (100 CpG window size, n = 195,170 between SO and SOA. Data from replicates are pooled. Differentially methylated tiles (p < 0.05) identified by logistic regression and with a methylation difference of ≥ 20% are highlighted in blue or red (hypomethylated in IFC and hypermethylated in IFC, respectively). b Heat map after unsupervised hierarchical clustering of all differentially methylated tiles (p < 0.05, 100 CpG window size, n = 14,795 between SO and SOA. The heatmap shows that the IFC group followed the same trend as SO, while the IV group was similar to SOA for these differentially methylated sites. c SeqMonk screenshot showing the methylation levels at Tcf4 locus (with 28 hypermethylated tiles). Each color-coded vertical bar represents the methylation value of a non-overlapping 100-CpG tile. Genes and oocyte mRNA are shown in red or blue depending on their direction of transcription (forward or reverse, respectively). d, e Venn diagrams showing the common hypomethylated and hypermethylated genes that were affected in IFC vs. SO, SO vs. SOA, and IFC vs. SOA

