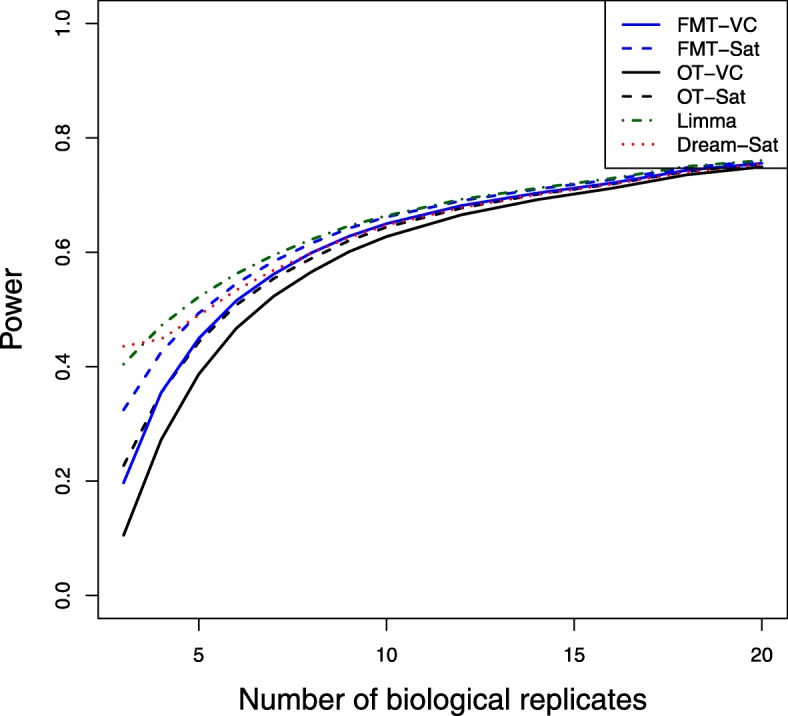
Fig. 1.

Power by numbers of biological replicates. Power was averaged over 100 simulation runs for 13 different sample sizes of biological replicates where the number of technical replicates equals 2 and the expected mean number of false positives equals 5. Different methods were used for the degrees of freedom approximation: FMT-VC (solid blue) is the fully moderated t-test with the variance components method; FMT-Sat (dotted blue) is the fully moderated t-test with the Welch-Satterthwaite method; OT-VC (solid black) is the ordinary t-test with the variance components method; OT-Sat (dotted black) is the ordinary t-test with the Welch-Satterthwaite method; Limma (dotted dark green) is the Limma method with replicates’ correlation estimation; Dream-Sat (dotted red) is the Dream method with the Welch-Satterthwaite method
