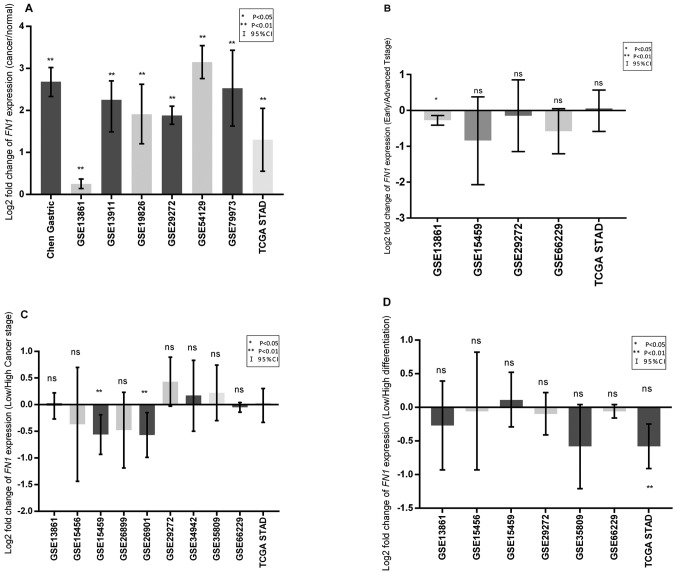
Figure 1.
Log2 fold change in FN1 gene expression in GC tissues. (A) FN1 expression in tumor tissues compared with that in normal tissues. (B) FN1 expression in the advanced T stage (T2 + T3 + T4) group compared with that in the early T stage (T1) group. (C) FN1 expression in the low differentiation group (high tumor grade) compared with that in the high differentiation group (intermediate and low tumor grade). (D) FN1 expression in the high clinical TNM stage (III+IV) group compared with that in the low clinical TNM stage (I+II) group. Error bars represent 95% confidence interval. *P<0.05 and **P<0.01 vs. normal tissue. FN1, fibronectin 1; TNM, Tumor-Node-Metastasis; ns, non-significant.

